
Image
|
Figure Caption
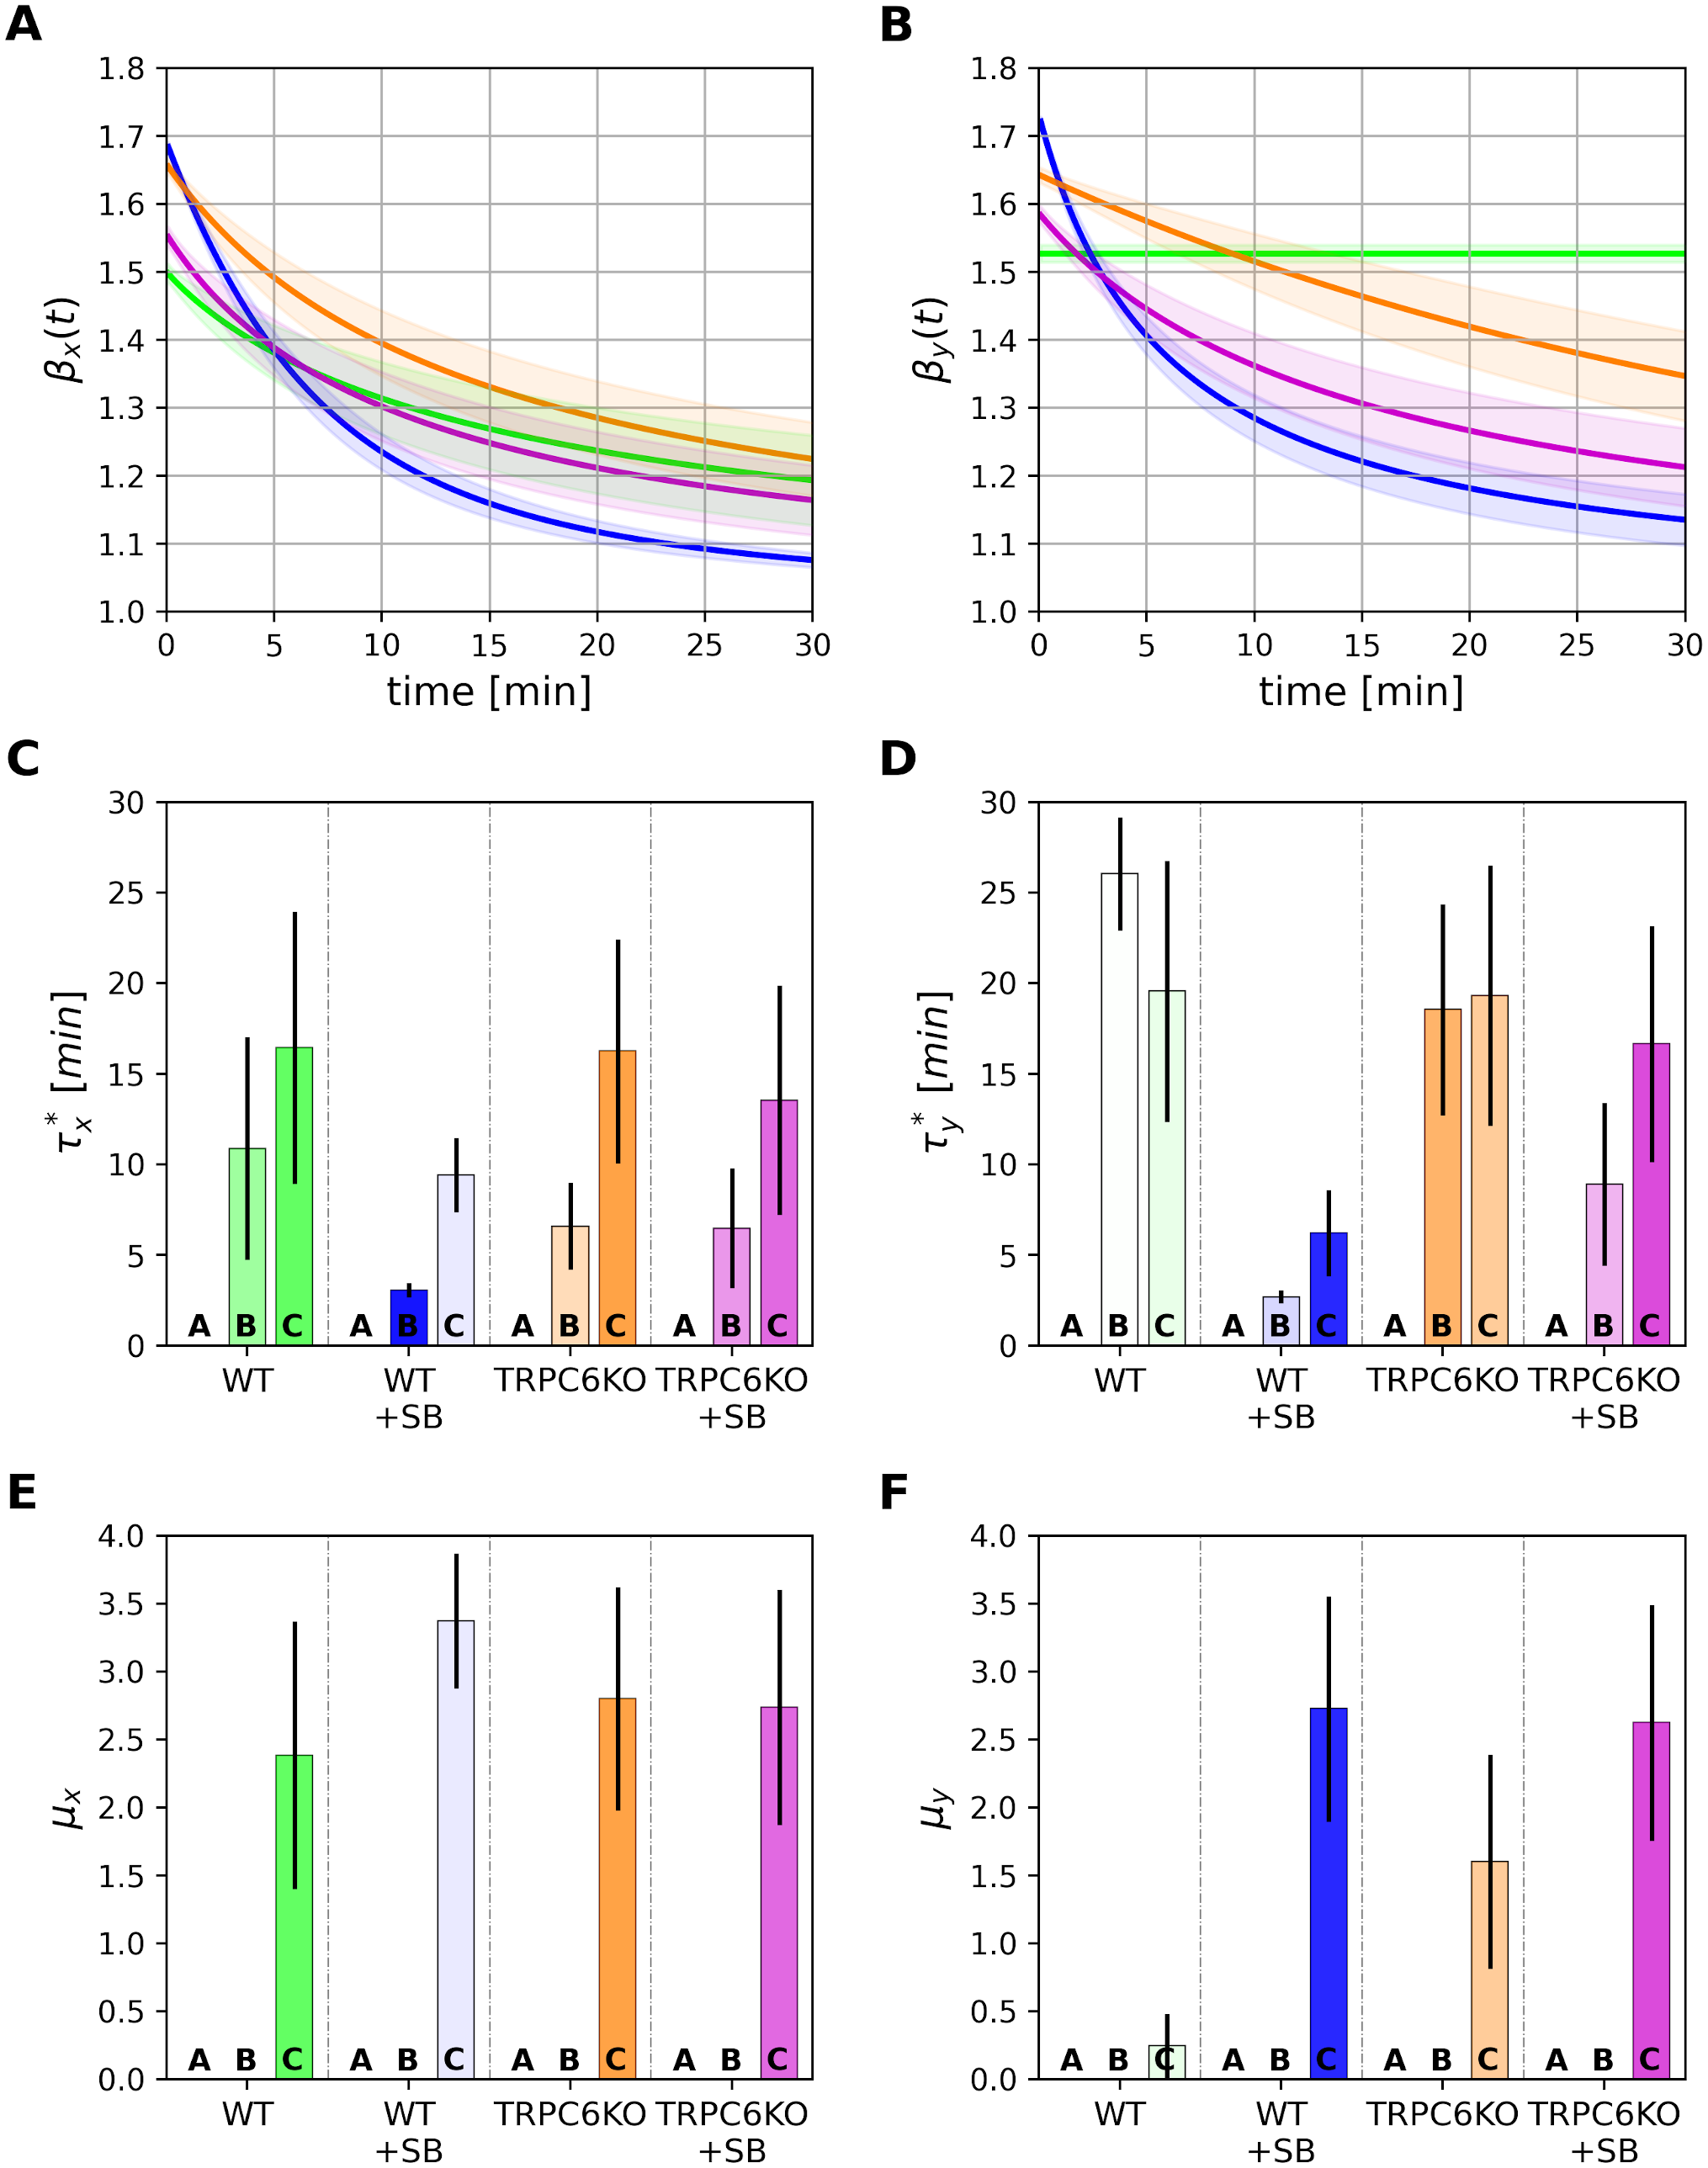
Fig. 5 Fig 5. Tempering behavior of murine neutrophils.
(A) and (B) show the temporal behavior of the logarithmic derivative β(t) of the mean squared displacement perpendicular (A) and parallel (B) to the direction of chemotaxis. The time-scale τ* of tempering is compared in (C) and (D) for the four different cell groups (τ* = ∞ for model A, pure fBm). (E) and (F) show the exponent μ of power-law tempering of model C. The color intensities of the parameter bars are proportional to the corresponding model probabilities given in Fig 4.
Acknowledgments
This image is the copyrighted work of the attributed author or publisher, and
ZFIN has permission only to display this image to its users.
Additional permissions should be obtained from the applicable author or publisher of the image.
Full text @ PLoS Comput. Biol.