
Image
|
Figure Caption
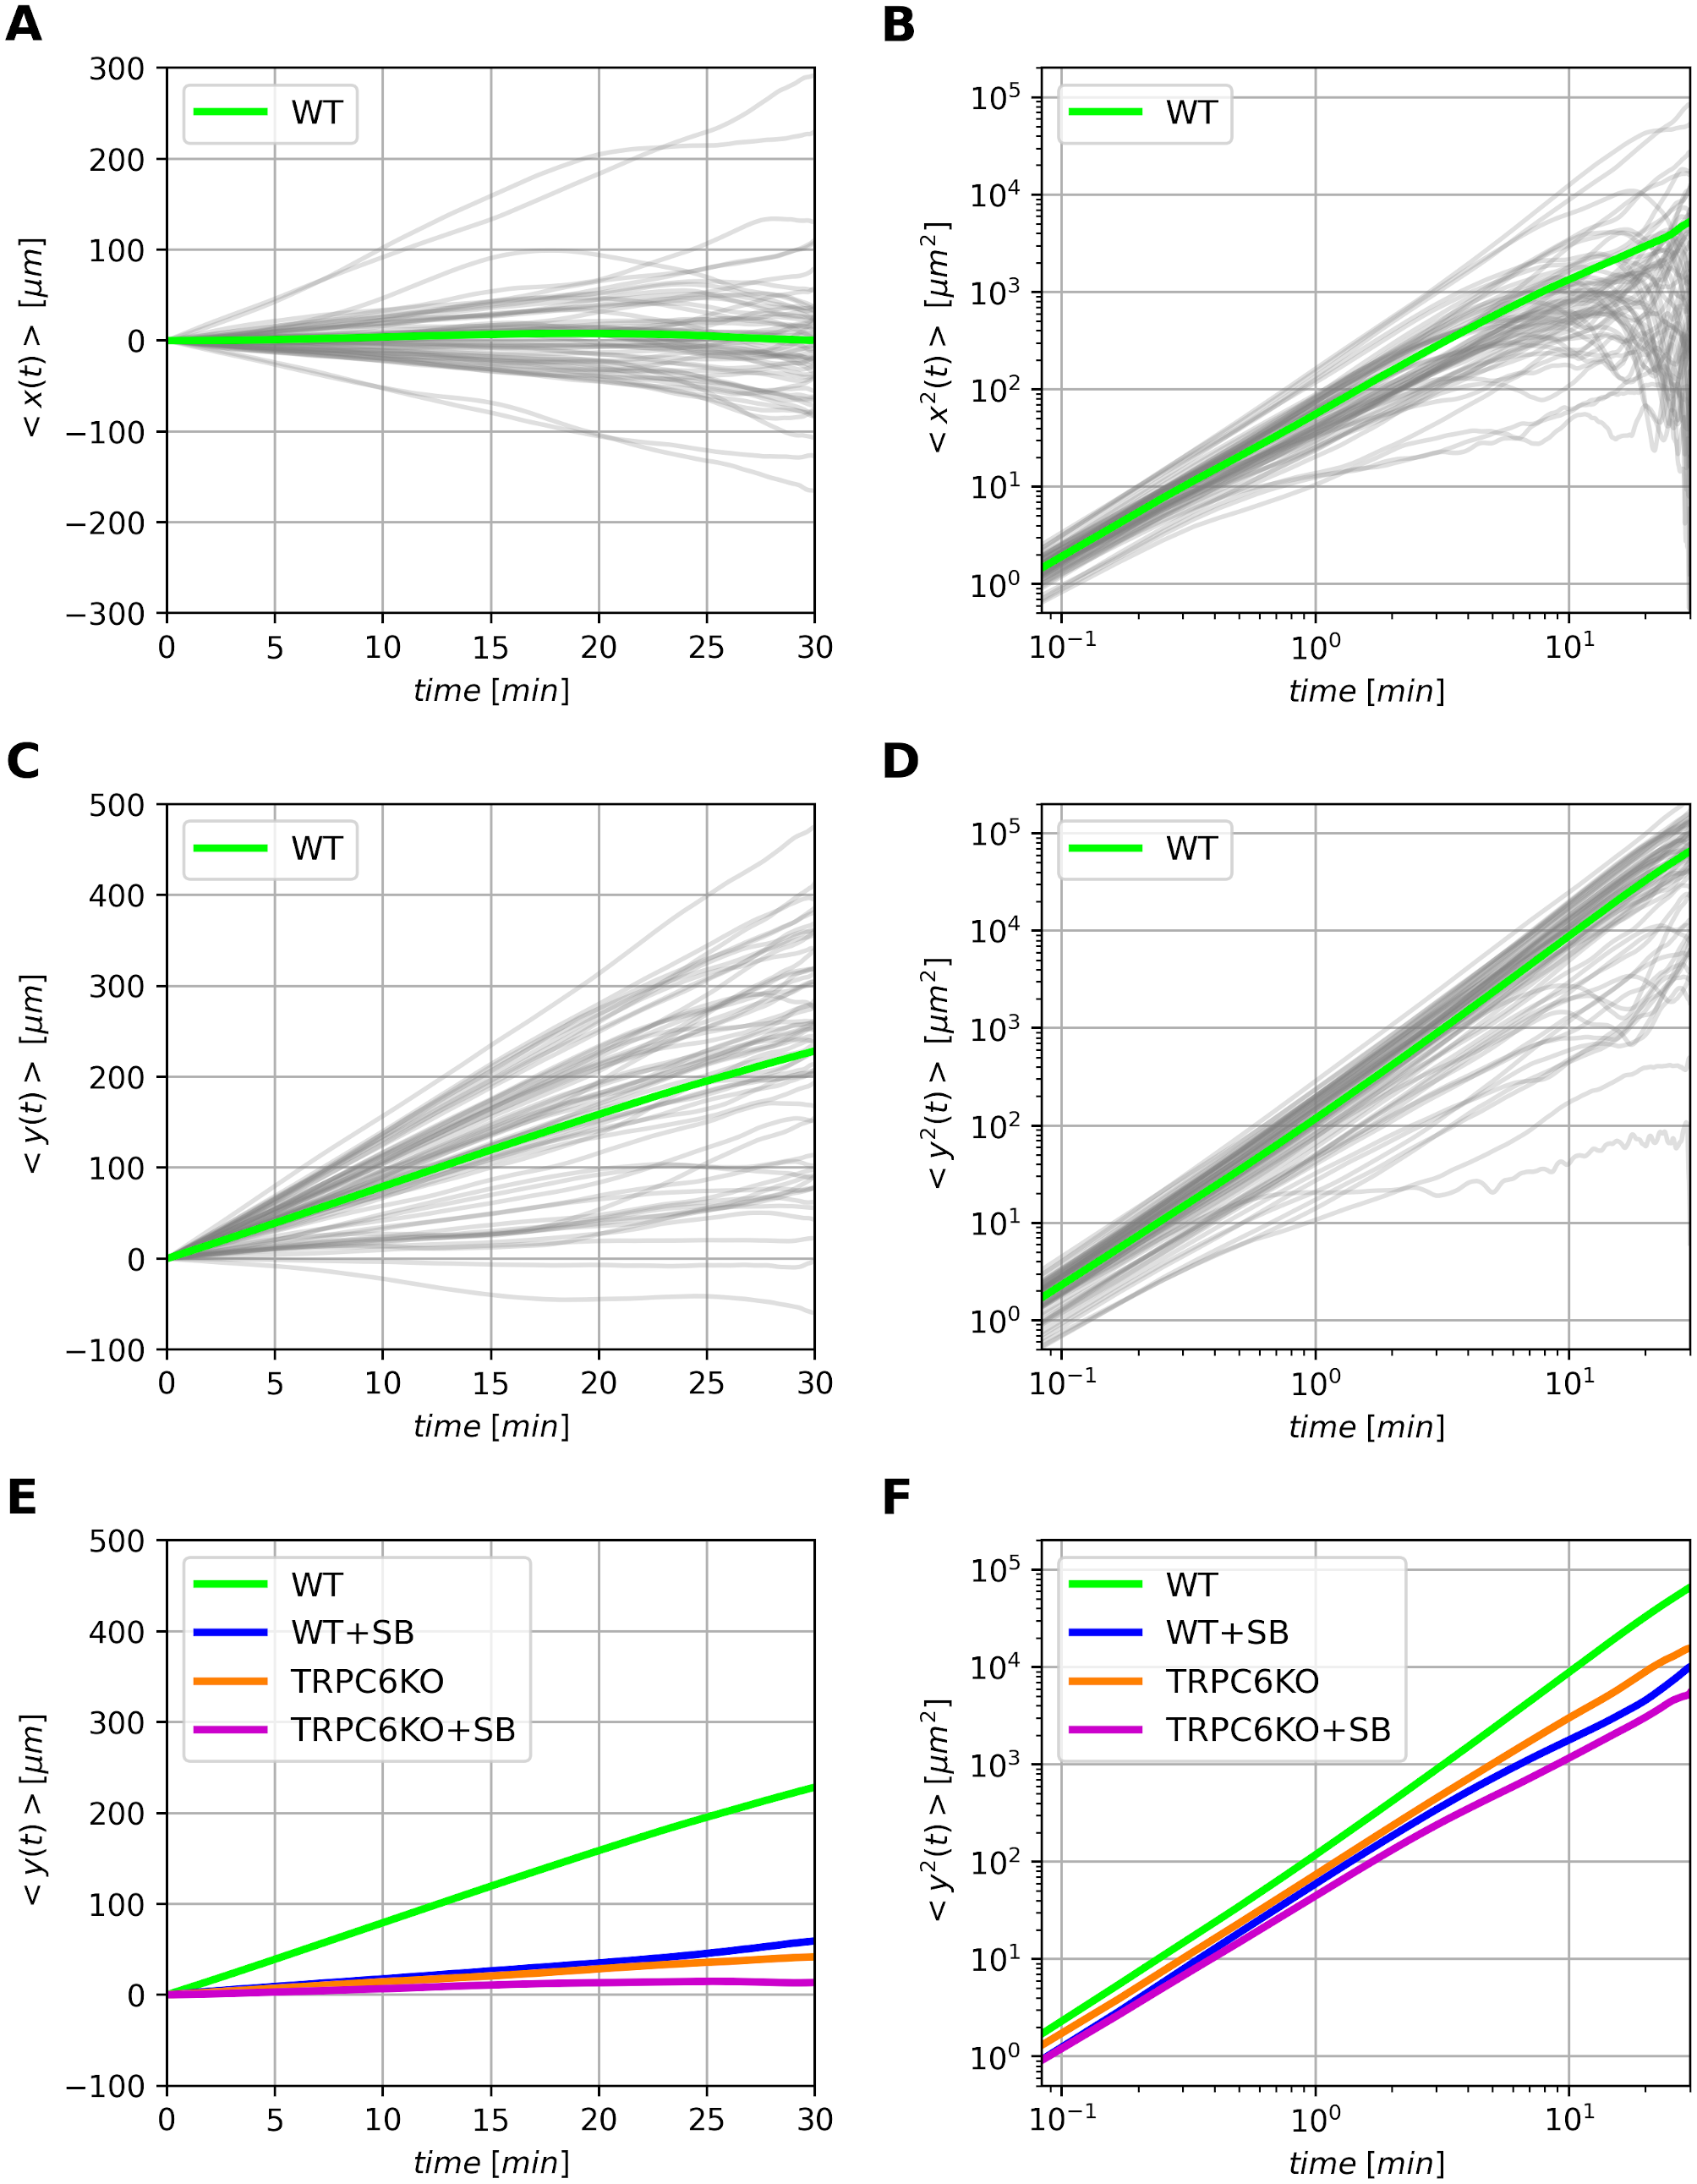
Fig. 2 (A), (B) and (C), (D) show the first and second moments of wildtype neutrophils with respect to x- and y-direction, respectively. Thin grey lines indicate time-averaged moments of single cells according to Eqs 16 and 17. The thick green lines show the time-ensemble-average of the corresponding moment according to Eqs 18 and 19. (E) compares the mean first moment of different experimental conditions with murine neutrophils. (F) shows the differences of the second moments, i.e. the mean squared displacement for murine neutrophils.
Acknowledgments
This image is the copyrighted work of the attributed author or publisher, and
ZFIN has permission only to display this image to its users.
Additional permissions should be obtained from the applicable author or publisher of the image.
Full text @ PLoS Comput. Biol.