
|
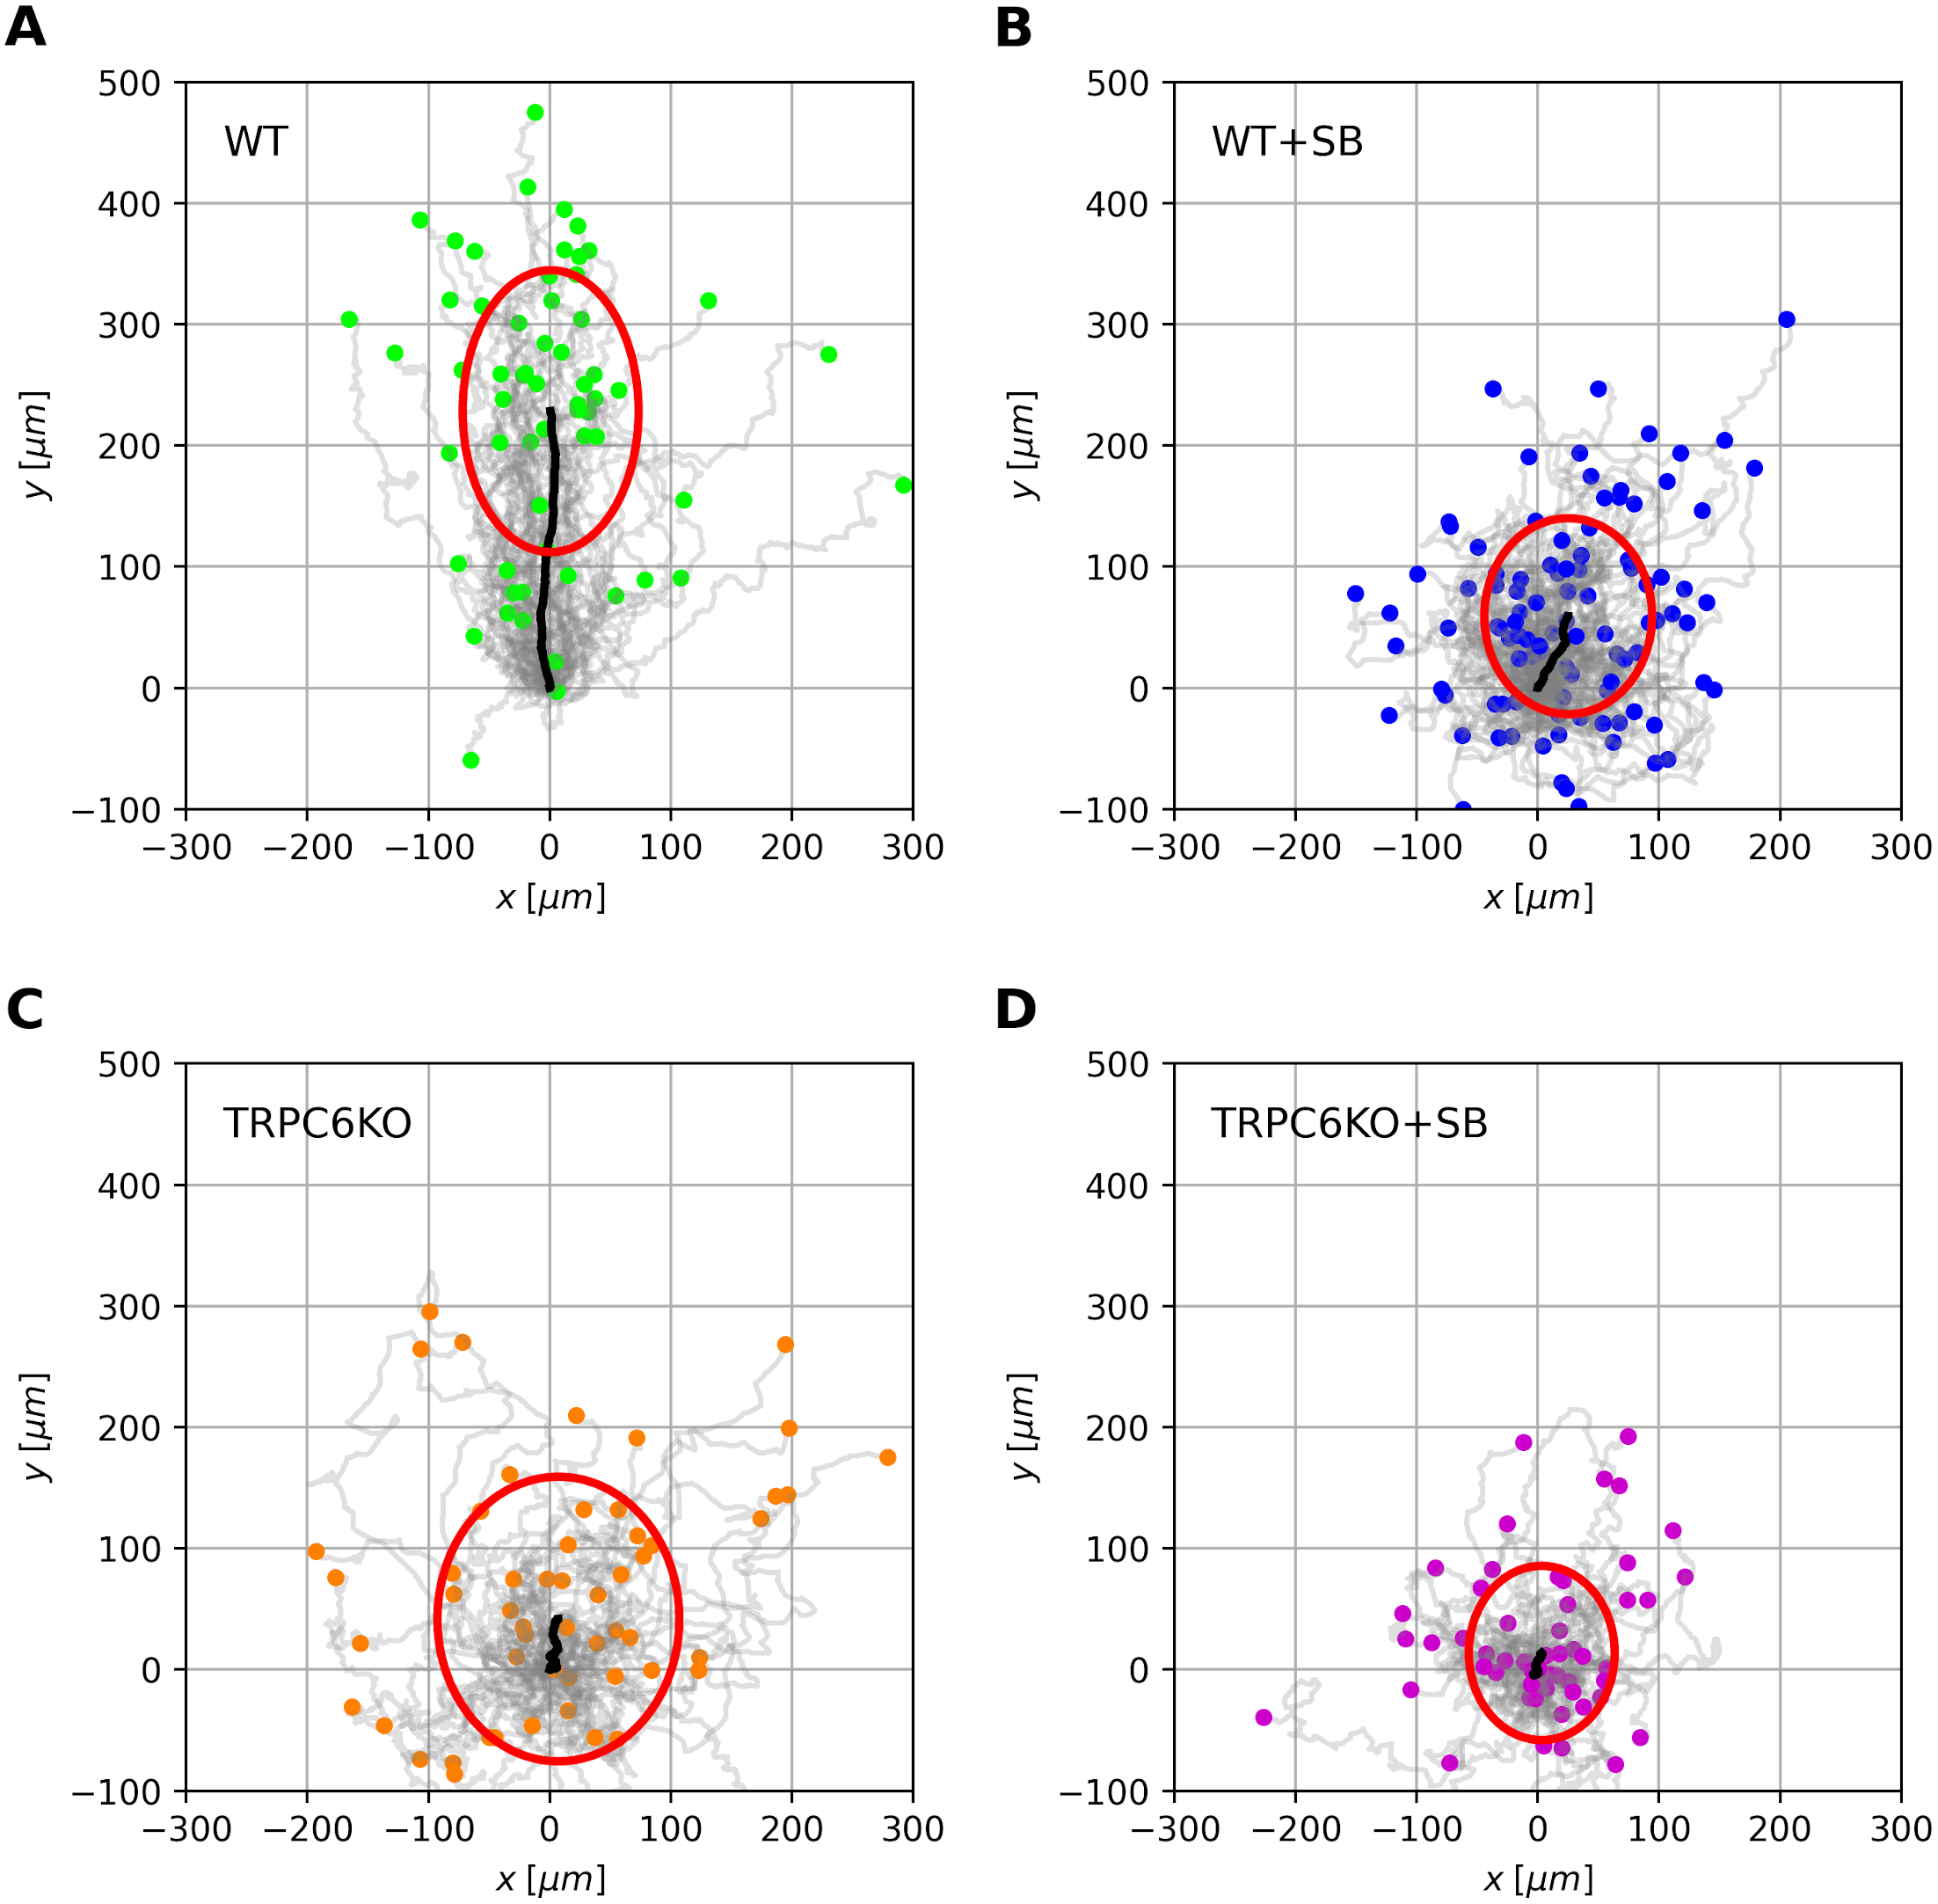
Fig. 1
(A)—(D) Paths of individual cells are normalized to a common starting point at the origin of the coordinate system. They are derived from different experimental conditions. Murine neutrophils were observed with a sampling interval of dt = 5 s over a time period of T = 30 min. Final cell positions are marked by colored circles (A-D). The black line indicates the mean position of the corresponding cell ensemble over the observation period T. The mean squared displacement of the cell ensemble after observation time T is represented as a red ellipse. The size of the ellipse indicates different propagation of cells in x- and y-direction. Murine neutrophils are chemotacting in a CLCX1 gradient along the positive y-axis. (A) Wildtype cells (WT). (B) Wildtype cells in the presence of the CXCR2 antagonist SB225002 (WT + SB). (C) TRPC6-knockout cells (TRPC6−/−). (D) TRCP6-knockout cells in the presence of CXCR2 antagonist SB225002 (TRPC6−/− + SB).