
Image
|
Figure Caption
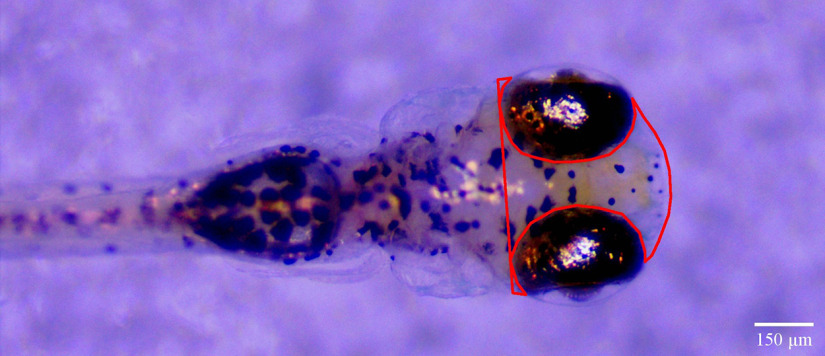
Figure 1.
Image of a zebrafish larva illustrating the area used for head size measurements. Dorsal view of a zebrafish larvae embedded in low melting point agarose. Red lines outline the area measured to determine the head size of larvae. Scale bar: 150 μm.
Acknowledgments
This image is the copyrighted work of the attributed author or publisher, and
ZFIN has permission only to display this image to its users.
Additional permissions should be obtained from the applicable author or publisher of the image.
Full text @ eNeuro