
IMAGE
Figure 5
- ID
- ZDB-IMAGE-220520-6
- Publication
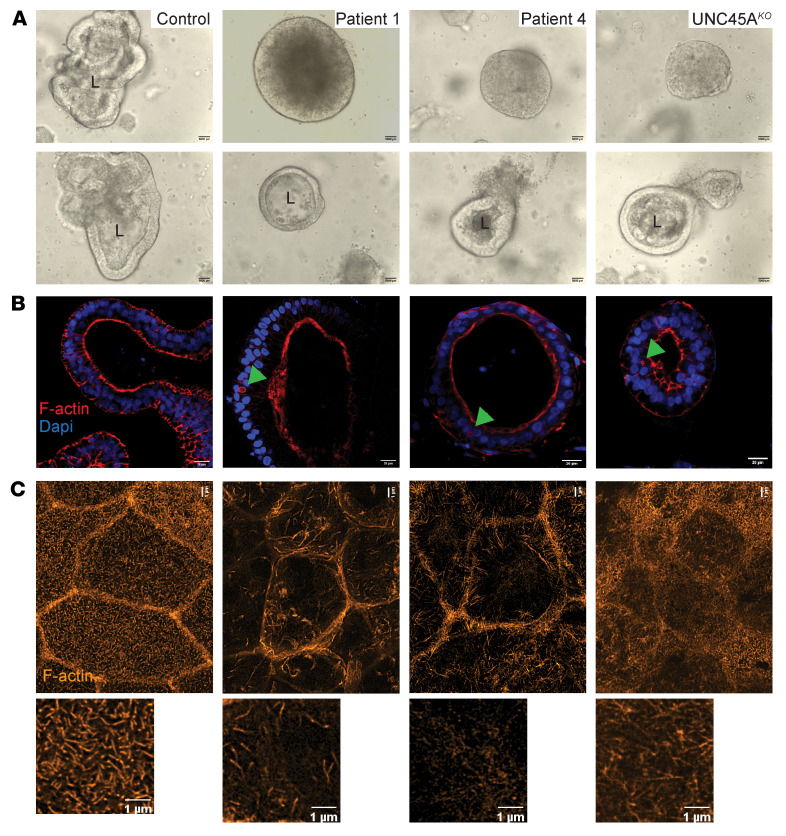
- Duclaux-Loras et al., 2022 - UNC45A deficiency causes microvillus inclusion disease-like phenotype by impairing myosin VB-dependent apical trafficking
- All Figures
- Figures for Duclaux-Loras et al., 2022
Image
|
Figure Caption
Figure 5
(
Acknowledgments
This image is the copyrighted work of the attributed author or publisher, and
ZFIN has permission only to display this image to its users.
Additional permissions should be obtained from the applicable author or publisher of the image.
Full text @ Journal of Clin. Invest.