
Figure 4
- ID
- ZDB-IMAGE-220520-5
- Publication
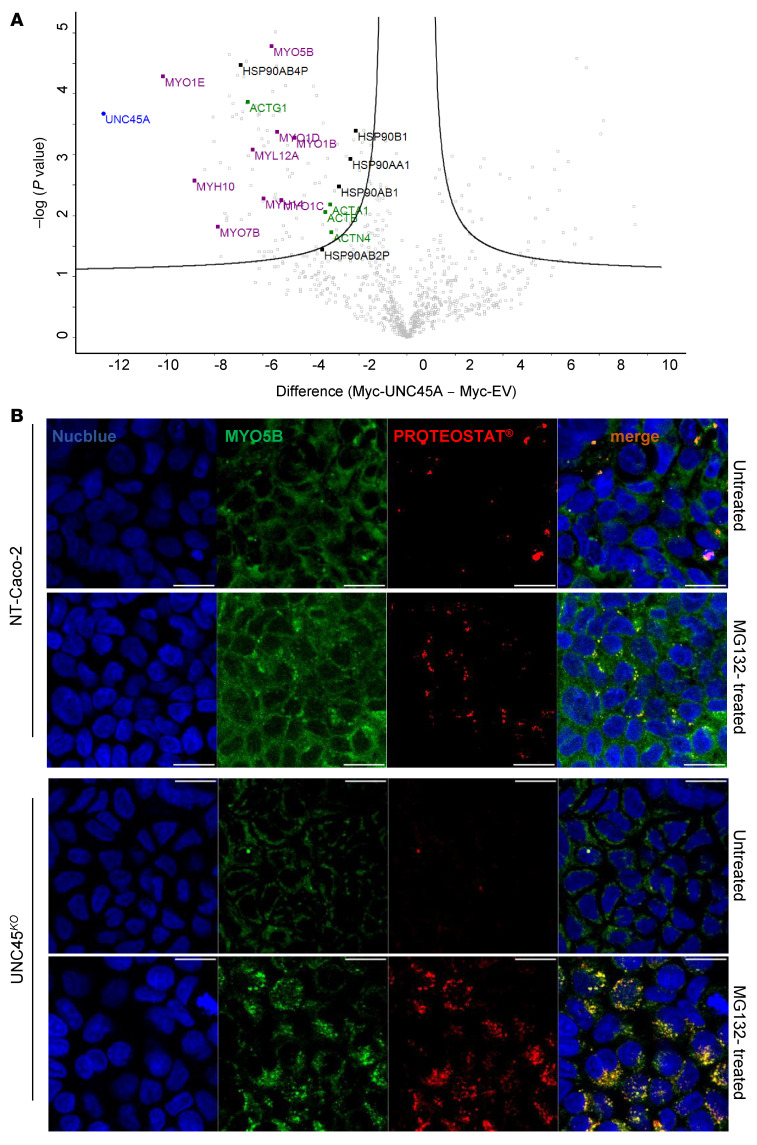
- Duclaux-Loras et al., 2022 - UNC45A deficiency causes microvillus inclusion disease-like phenotype by impairing myosin VB-dependent apical trafficking
- All Figures
- Figures for Duclaux-Loras et al., 2022
|
Figure 4
(