
Fig. 3
- ID
- ZDB-IMAGE-220520-45
- Publication
- Brunsdon et al., 2022 - Aldh2 is a lineage-specific metabolic gatekeeper in melanocyte stem cells
- All Figures
- Figures for Brunsdon et al., 2022
|
Fig. 3
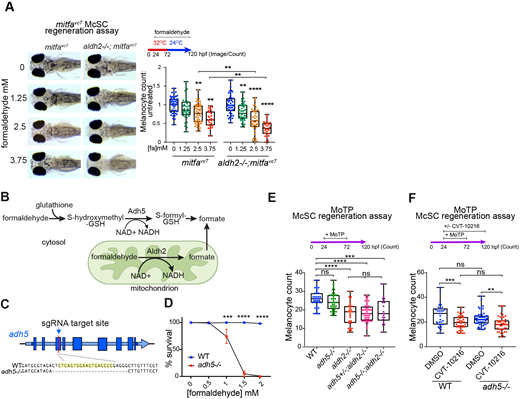
McSCs require Aldh2, but not Adh5, for formaldehyde metabolism. (A) Melanocyte regeneration is sensitive to formaldehyde and this effect is stronger in aldh2−/− mutants. Images and quantification of melanocytes in zebrafish embryos in a mitfavc7 regeneration assay. Melanocyte counts were normalised to the mean of the respective control, each dot represents a single embryo; boxes indicate median and quartiles; whiskers span minimum to maximum values; three experimental replicates. **P<0.0021, ****P<0.0001 (one-way ANOVA with Tukey's multiple comparisons). (B) Schematic diagram of formaldehyde metabolism by Adh5 (cytosol) and Aldh2 (mitochondria). (C) Schematic diagram showing the adh5−/− CRISPR-Cas9 mutant, with sgRNA target site in exon 3 and alignment to wild-type sequence showing a deletion of 25 bp. (D) Sensitivity of adh5−/− embryos to increasing concentrations of formaldehyde from 24 hpf for 24 h, and surviving embryos quantified. Five experimental replicates, 20 embryos per condition. ***P<0.0002, ****P<0.0001 (two way ANOVA with Sidak's multiple comparisons). Data are mean±s.e.m. (E) MoTP regeneration assay on aldh2−/−, adh5−/− mutant embryos and embryos from an incross of adh5+/−; aldh2−/− fish (embryos genotyped after counting). One data point plotted per embryo; boxes indicate median and quartiles; whiskers span minimum to maximum values; three experimental replicates. ***P<0.0002, ****P<0.0001; ns, not significant (one-way ANOVA with Tukey's multiple comparisons). (F) MoTP regeneration assay on wild type and adh5−/− mutants treated with or without CVT-10216. One data point plotted per embryo; boxes indicate median and quartiles; whiskers span minimum to maximum values; three experimental replicates. ***P<0.0002, **P<0.0021; ns, not significant (one-way ANOVA with Tukey's multiple comparisons).