
Fig. 6
- ID
- ZDB-IMAGE-220519-29
- Publication
- Kwon et al., 2022 - Peripheral NOD-like receptor deficient inflammatory macrophages trigger neutrophil infiltration into the brain disrupting daytime locomotion
- All Figures
- Figures for Kwon et al., 2022
|
Fig. 6
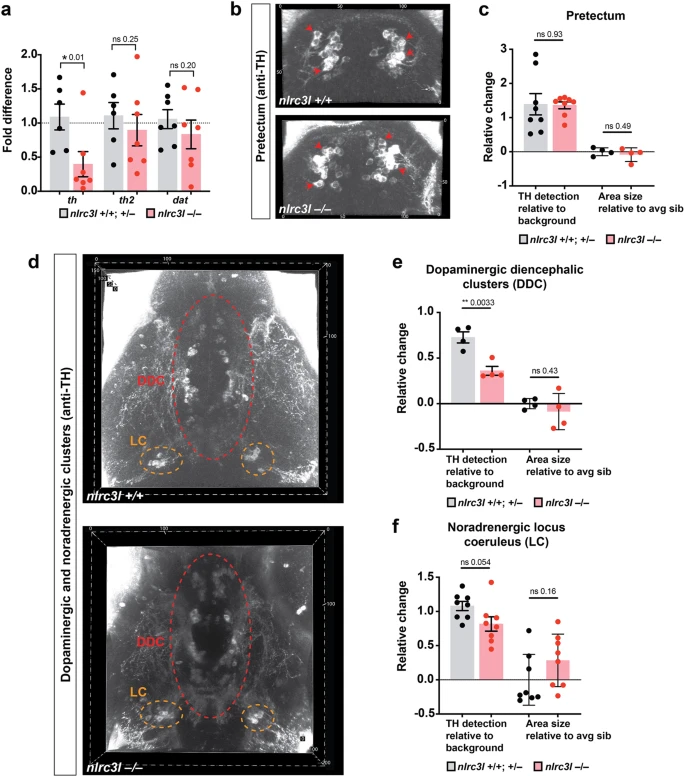
a Bar chart conveys qPCR analysis of dopaminergic system genes (th, th2, and dat), indicating a significant decrease in th mRNA expression in nlrc3l mutants. b Anti-TH immunostaining characterization of the pretectal dopaminergic neurons (red arrows) at 6 dpf shows no apparent difference between nlrc3l mutant and control wild-type. c Quantification of the relative TH protein level and relative area of TH + staining. d–f Characterization of the ventral larval brain at 6 dpf shows a large significant reduction in TH protein level in the posterior tuberculum of the DDC, and a modest and nearly significant decrease in the noradrenergic locus coeruleus (LC). Right, quantifications of the relative TH protein level and relative area of TH + staining in the DDC and LC. c, e, f Area was determined relative to the average (avg) area size of wild-type and heterozygous siblings (sib). Two-tailed t-test was used to determine statistical significance. Error bars show standard error of mean for relative TH staining and standard deviation for relative area.