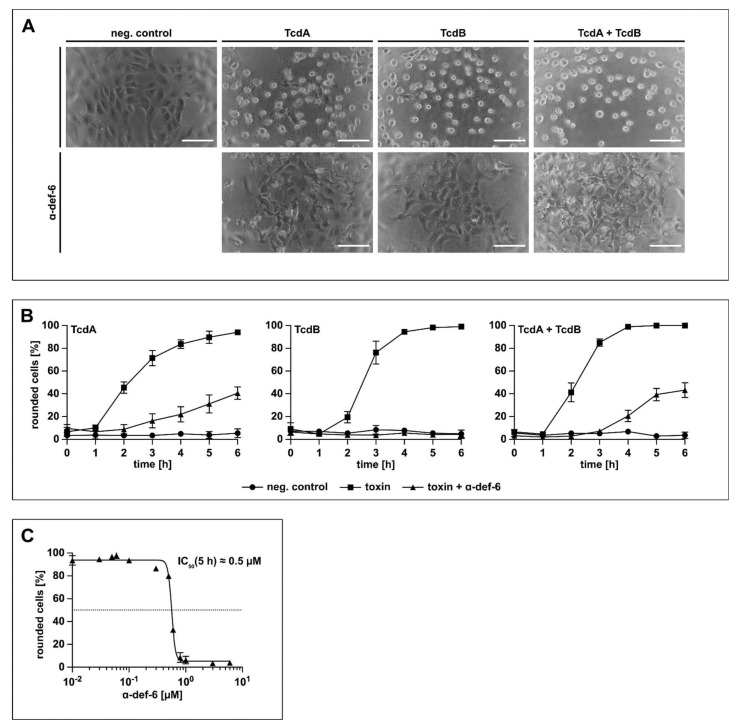
α-def-6 protects Vero cells from intoxication with TcdA, TcdB and the combination of both toxins. (A) Vero cells were intoxicated with TcdA (20 pM), TcdB (10 pM) or the combination of both toxins in the presence or absence of α-def-6 (6 µM). For control, the cells were left untreated. Representative images after 6 h incubation time are shown (n = 3). Scale bars correspond to 100 µm. (B) Vero cells were treated as in (A). The amount of rounded, i.e., intoxicated cells was determined hourly. Values are given as mean ± SD of three technical replicates. Three biological replicates exhibited comparable intoxication and inhibition (n = 3). (C) The concentration-dependent inhibition of TcdB (10 pM) was analyzed by incubating Vero cells with a concentration series of α-def-6 (ranging from 0.01 µM to 6 µM). After 5 h, images were taken, and the percentage of rounded cells was determined. Depicted is the mean ± SD of three technical replicates. Nonlinear fit was applied with GraphPad Prism via log(inhibitor) vs. response (variable slope, four parameters). Under this defined condition, an estimated IC50 value of about 0.5 µM was measured. The value was derived from three biological replicates, each with three technical replicates (n = 3).
Acknowledgments
This image is the copyrighted work of the attributed author or publisher, and
ZFIN has permission only to display this image to its users.
Additional permissions should be obtained from the applicable author or publisher of the image.
Full text @ Int. J. Mol. Sci.
Your Input Welcome
Thank you for submitting comments. Your input has been emailed to ZFIN curators who may contact you if
additional information is required.
Oops. Something went wrong. Please try again later.