IMAGE

Figure 7

ID
ZDB-IMAGE-220518-34
Source
Figures for Ding et al., 2022
Image
Figure Caption

Figure 7

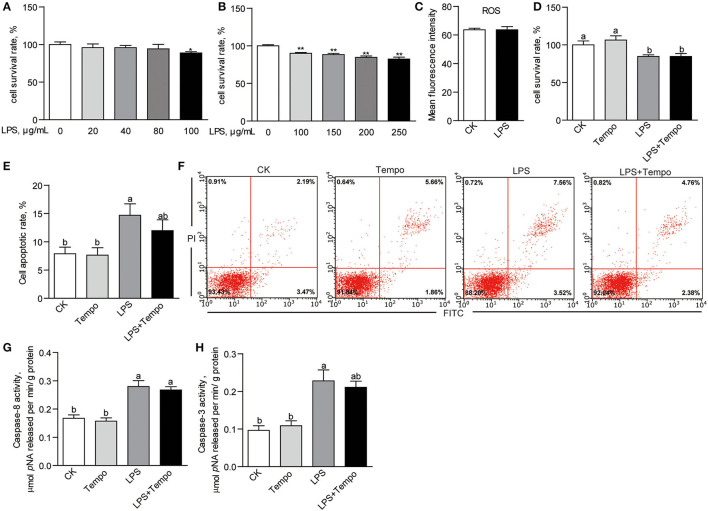
The effects of LPS on cell viability and apoptosis of ZFL cells. (A) The cell survival rates of ZFL cells treated with lower concentrations of LPS for 24 h. (B) The cell survival rates of ZFL cell treated with higher concentrations of LPS for 24 h. (C) The intracellular ROS of ZFL cells treated with 100 μg/ml LPS for 24 h. (D) The cell survival rates and (E) cell apoptotic rates of ZFL cells co-treated with LPS and tempo for 24 h. (F) The representative images of cell apoptosis of ZFL cells co-treated with LPS and tempo for 24 h. The activities of (G) caspase-8 and (H) caspase-3 in ZFL cells co-treated with DHA and tempo for 24 h. The values are means ± SEMs (n = 3–8 biological replicates). The mean values without a common letter are significantly different, p < 0.05. *p < 0.05, **p < 0.01.

Acknowledgments
This image is the copyrighted work of the attributed author or publisher, and ZFIN has permission only to display this image to its users. Additional permissions should be obtained from the applicable author or publisher of the image. Full text @ Front Nutr