
Fig. 4
- ID
- ZDB-IMAGE-220517-6
- Publication
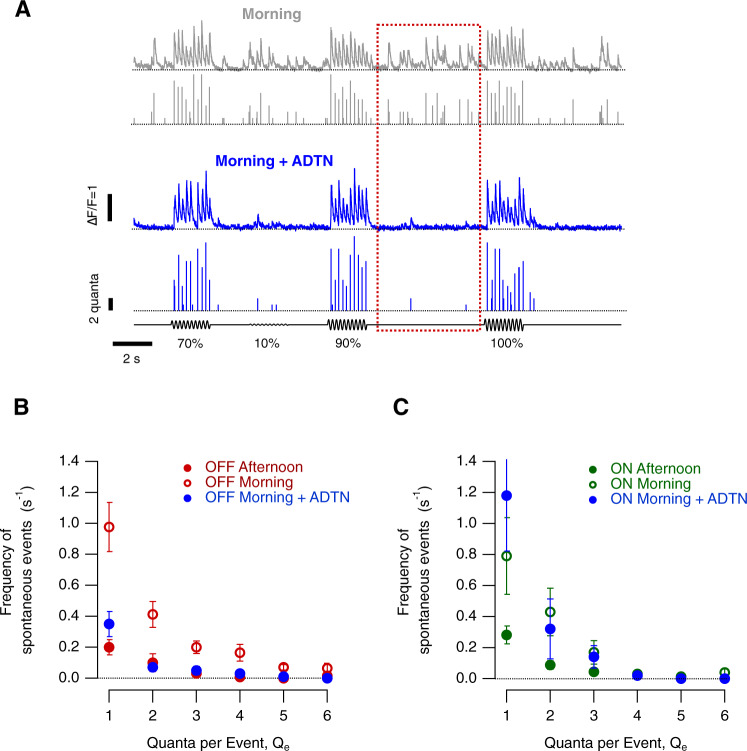
- Moya-Díaz et al., 2022 - Diurnal changes in the efficiency of information transmission at a sensory synapse
- All Figures
- Figures for Moya-Díaz et al., 2022
|
Fig. 4