
Image
|
Figure Caption
Fig. 2
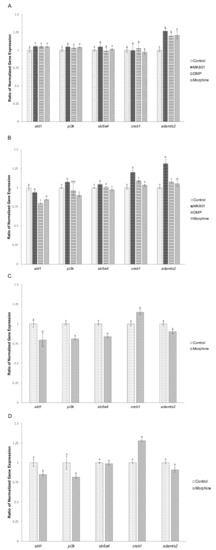
Figure 2. Altered gene expression in zebrafish larvae following exposure to MK801, DMP and morphine, and morphine withdrawal. (A) Effect of short-term (3-day) drug exposure on expression of akt1 (F (3,32) = 1.386, p = 0.265), pi3k (F (3,32) = 1.127, p = 0.299), slc64a (F (3,32) = 1.721, p = 0.182), creb1 (F (3,32) = 0.522, p = 0.667) and adamst2 (F (3,32) = 2.771, p = 0.058). (B) Effect of long-term (10-day) drug exposure on expression of akt1 (F (3,32) = 14.546, p < 0.001), pi3k (F (3,32) = 6.650, p < 0.001), slc64a (F (3,32) = 25.115, p < 0.001), creb1 (F (3,32) = 29.607, p < 0.001) and adamst2 (F (3,32) = 90.337, p < 0.001). (C) Effect of short-term morphine exposure followed by 5-day withdrawal on expression of akt1 (t (16) = 8.945, p = 0.003), pi3k (t (16) = 8.082, p = 0.001), slc6a4 (t (16) = 5.591, p = 0.001), creb1 (t (16) = 6.394, p = 0.001), adamts2 (t (16) = 0.306, p = 0.064). (D) Effect of long-term morphine exposure followed by 5-day withdrawal on expression of akt1 (t (16) = 8.945, p = 0.003), pi3k (t (16) = 27.493, p < 0.001), slc6a4 (t (16) = 2.445, p = 0.058), creb1 (t (16) = 6.102, p < 0.001), adamts2 (t (16) = 5.709, p = 0.001). Data expressed as mean ± SEM, n = 50 of 3 independent experiments. Different lowercase letters indicate statistically significant values, p < 0.05. DMP: domperidone.
Acknowledgments
This image is the copyrighted work of the attributed author or publisher, and
ZFIN has permission only to display this image to its users.
Additional permissions should be obtained from the applicable author or publisher of the image.
Full text @ Int. J. Mol. Sci.