
Image
|
Figure Caption
Fig. 1
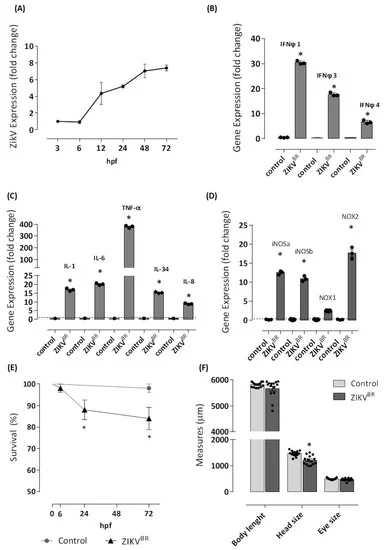
Figure 1. ZIKV infects one-cell stage embryo. The infection (n = 98) was performed by microinjecting embryos at 0 hpf with approximately 2 or 3 nL of ZIKVBR (1 × 10⁷ PFU/mL, 2 a.p.) utilizing a M205C stereomicroscope coupled with an Injectman® 4 microinjector. Another group (n = 83) was left without injection and formed the negative control group. Embryos were incubated in E2 0.5× medium at 28 °C, and viral RNA extracted from entire larvae was used for measurements via real-time quantitative PCR (qRT-PCR) after 3, 6, 12, 24, 48, and 72 hpf of the Zika viral load (A). Then, 72 hpf-infected larvae were sampled for qRT-PCR analysis of (B) IFNφ1, IFNφ3, and IFNφ4. cDNA was used in qRT-PCR reaction using primers specific for zebrafish, IL-1, TNF, IL-6, IL-8, and IL-34 (C), and iNOSa, iNOSb, NOX1, and NOX2 (D). The relative expression was normalized to the expression of EF-1a or GAPDH, and it is expressed as fold induction relative to the expression level in the control group (dotted line). For the analysis of gene expression, genes with fold change ≥1.5 were considered differentially expressed. ZIKV infection led to 14 and 16% of mortality (E), and a reduction of 17% of the head size was observed in ZIKV-injected larvae (F). Each bar represents the mean ± SEM. * p < 0.05 compared with the negative control group.
Acknowledgments
This image is the copyrighted work of the attributed author or publisher, and
ZFIN has permission only to display this image to its users.
Additional permissions should be obtained from the applicable author or publisher of the image.
Full text @ Cells