
Image
|
Figure Caption
Fig. 3
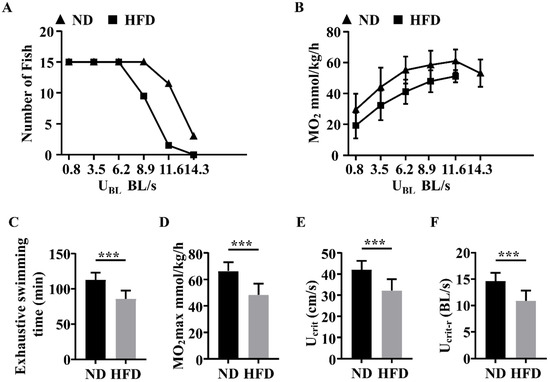
Figure 3. Comparison of swimming capacity tests between the two groups of zebrafish. (A) The number of zebrafish in the two groups at each speed test stage. (B) MO2 levels in the two groups at each testing stage. (C) Exhaustive swimming times of zebrafish. (D) MO2max of zebrafish. (E) Ucrit of zebrafish. (F) Ucrit-r of zebrafish. ***, p < 0.001. Data represent means, and error bars represent standard errors of the means. Scale bar, 20 μm. ND, normal diet; HFD, high-fat diet; Ucrit, critical swimming speed; MO2, oxygen consumption.
Figure Data
Acknowledgments
This image is the copyrighted work of the attributed author or publisher, and
ZFIN has permission only to display this image to its users.
Additional permissions should be obtained from the applicable author or publisher of the image.
Full text @ Nutrients