
Image
|
Figure Caption
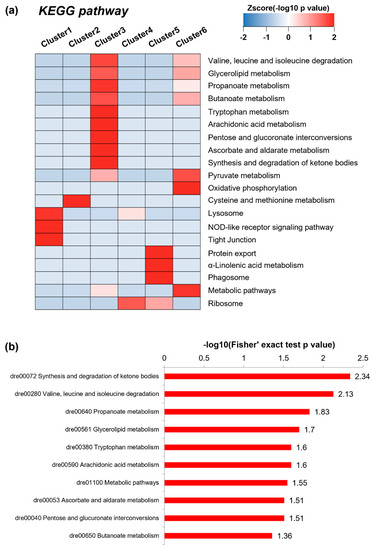
Fig. 3 Figure 3. (a) KEGG pathway-based enrichment analysis in clusters 1~6. The enrichment efficiency was evaluated by −log 10 of p values. (b) KEGG pathway-based enrichment analysis using proteins grouped in cluster 3. The Fisher’s exact test p value was used to evaluate the enrichment efficiency.
Acknowledgments
This image is the copyrighted work of the attributed author or publisher, and
ZFIN has permission only to display this image to its users.
Additional permissions should be obtained from the applicable author or publisher of the image.
Full text @ Int. J. Environ. Res. Public Health