
Image
|
Figure Caption
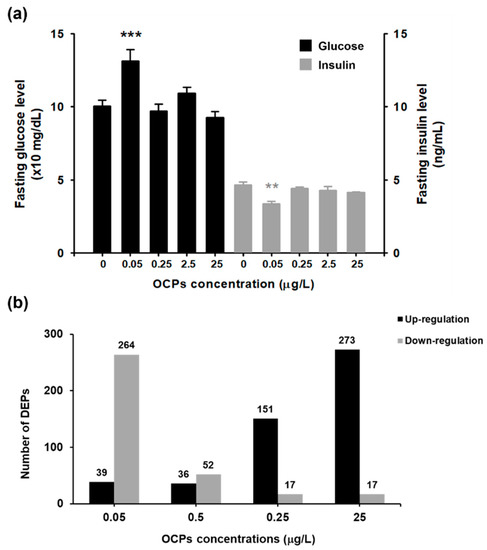
Fig. 1 Figure 1. Blood analysis and protein identification in zebrafish exposed to organochlorine pesticide mixtures at concentrations of 0.05, 0.25, 2.5 and 25 μg/L: (a) The fasting glucose level (×10 mg/dL, black) and fasting insulin level (ng/mL, gray) were described with the color difference and designed by *** p < 0.001 and ** p < 0.01; (b) The number of up- (black) and down-regulated (gray) proteins was shown.
Figure Data
Acknowledgments
This image is the copyrighted work of the attributed author or publisher, and
ZFIN has permission only to display this image to its users.
Additional permissions should be obtained from the applicable author or publisher of the image.
Full text @ Int. J. Environ. Res. Public Health