IMAGE

Figure 2

ID
ZDB-IMAGE-220515-5
Source
Figures for Xu et al., 2022
Image
Figure Caption

Figure 2

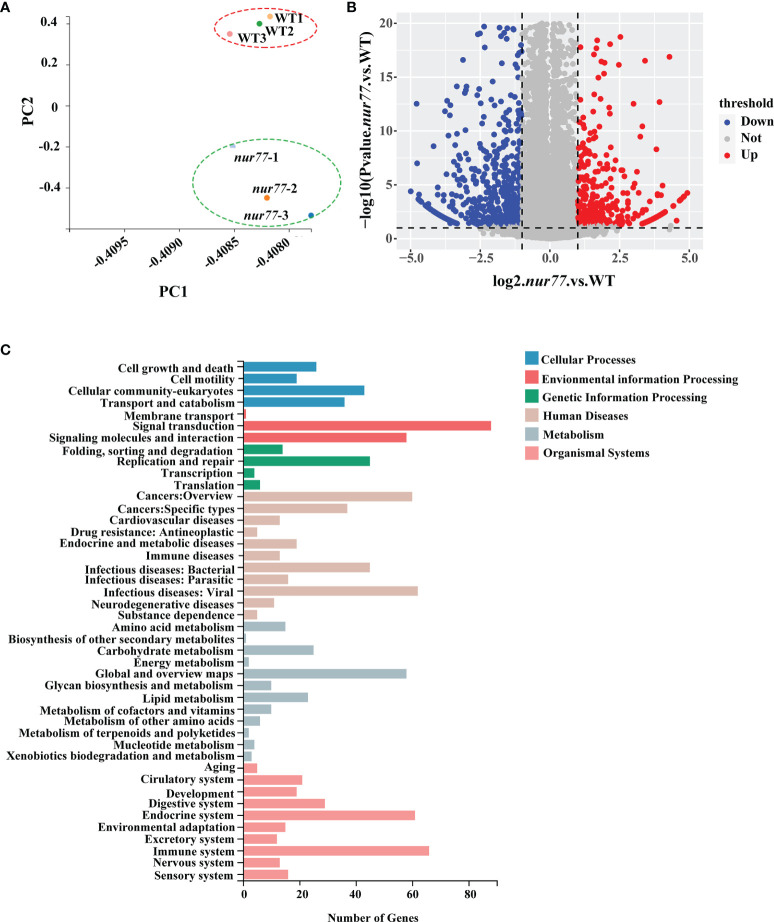
RNA-seq (RNA sequencing) analysis of nur77−/− mutant zebrafish. (A) Principal component analysis (PCA) plot of three wild-type and three nur77−/− mutant RNA-seq datasets. Principal component 1 (PC1) and principal component 2 (PC2) were used for analysis. (B) Volcano plot of differential gene expression analysis of nur77−/− mutant and control larvae showing the relationship between p-value and log fold changes. Red shows upregulated genes and blue downregulated genes. (C) Kyoto Encyclopedia of Genes and Genomes (KEGG) enrichment analysis of DEGs in pathways. The y-axis indicates pathways, and the x-axis indicates the number of DEGs.

Acknowledgments
This image is the copyrighted work of the attributed author or publisher, and ZFIN has permission only to display this image to its users. Additional permissions should be obtained from the applicable author or publisher of the image. Full text @ Front Endocrinol (Lausanne)