IMAGE

Figure 7

ID
ZDB-IMAGE-220515-10
Genes
Source
Figures for Xu et al., 2022
Image
Figure Caption

Figure 7

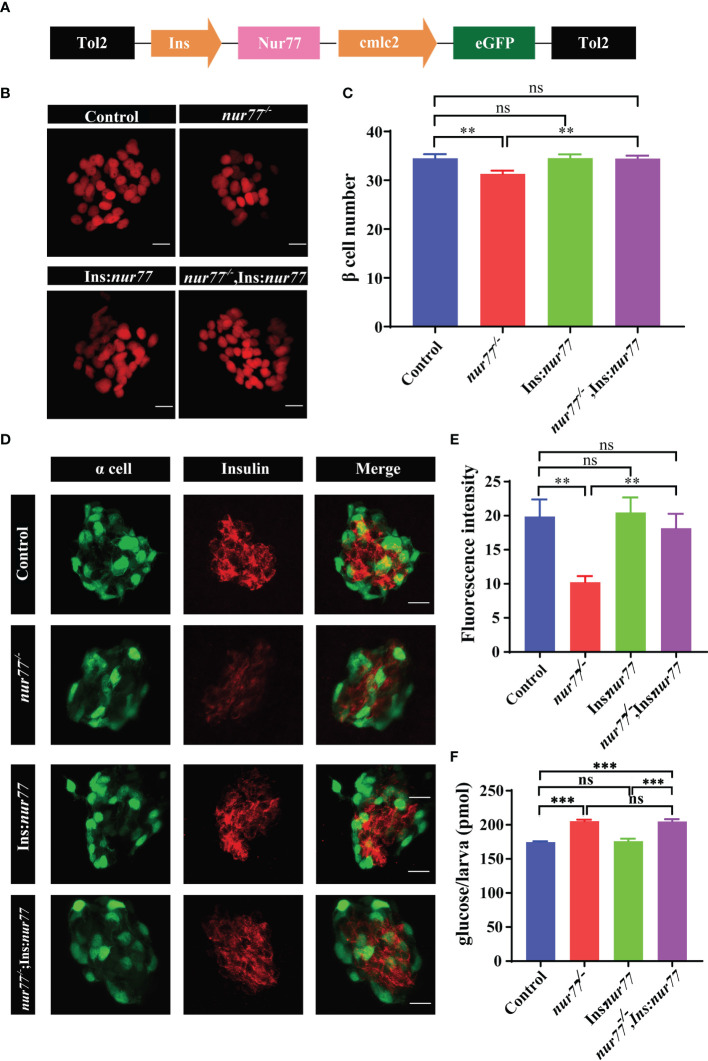
Targeted expression of Nur77 in β cells restored β-cell number and insulin content in zebrafish. (A) Schematic representation of the Tg(Ins : Nur77; cmlc2:eGFP) transgenic line and the expression pattern. Expression of Nur77 was controlled by the zebrafish insulin promoter with cmlc2-driven eGFP used as an indication of transgene carriers. (B, C) Representative images (B) and quantification (C) of β-cell number in Tg(Ins:H2BmCherry), nur77−/−;Tg(Ins:H2BmCherry), Tg(Ins : Nur77);Tg(Ins:H2BmCherry) and nur77−/−; Tg(Ins : Nur77);Tg(Ins:H2BmCherry) zebrafish larvae. The number of larvae (n = 20~30). (D, E) Representative images (D) and quantification (E) of the insulin fluorescence intensity in β cells from Tg(gcg:eGFP), nur77−/−;(gcg:eGFP), Tg(Ins : Nur77);Tg(gcg:eGFP) and nur77−/−; Tg(Ins : Nur77);Tg(gcg:eGFP) zebrafish larvae. Tg(gcg:eGFP) was used to indicate the pancreatic α cell, and β cell are indicated with red fluorescence by immunostaining with insulin antibody (n = 12~15). (F) The total free glucose contents in Tg(gcg:eGFP), nur77−/−;(gcg:eGFP), Tg(Ins : Nur77);Tg(gcg:eGFP) and nur77−/−; Tg(Ins : Nur77);Tg(gcg:eGFP) zebrafish larvae (n = 3). ns, no significance; **p < 0.01, ***p < 0.001 by one-way ANOVA.

Figure Data
Acknowledgments
This image is the copyrighted work of the attributed author or publisher, and ZFIN has permission only to display this image to its users. Additional permissions should be obtained from the applicable author or publisher of the image. Full text @ Front Endocrinol (Lausanne)