
Fig. 5
- ID
- ZDB-IMAGE-220513-34
- Publication
- Hortle et al., 2022 - OXSR1 inhibits inflammasome activation by limiting potassium efflux during mycobacterial infection
- All Figures
- Figures for Hortle et al., 2022
|
Fig. 5
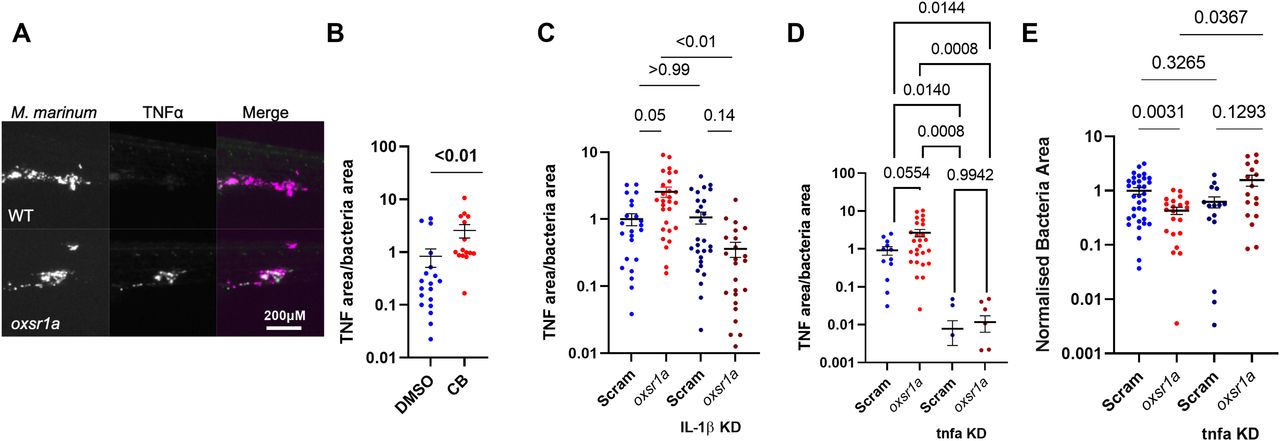
(A) Representative images of Tg(tnfa:GFP)pd1028 fluorescence around M. marinum granulomas. Scale bar represents 200 μM. (B) Quantification of TNF-α fluorescence per bacterial area in WT embryos treated with Compound B. (C) Quantification of TNF-α fluorescence per bacterial area in WT, mosaic F0 oxsr1a, Il1b, and dual oxsr1a Il1b crispant embryos. Combined results of two independent experiments. (D) Quantification of TNF-α fluorescence per bacterial area in WT, mosaic F0 oxsr1a, tnfa, and dual oxsr1a tnfa crispant embryos. Combined results of two independent experiments. (E) Quantification of bacterial burden in WT, mosaic F0 oxsr1a, tnfa, and dual oxsr1a tnfa crispant embryos. Combined results of two independent experiments. Fish were infected with WT M. marinum by caudal vein injection at 30 h post fertilization and analysed 5 dpi.