
Fig. 5
- ID
- ZDB-IMAGE-220512-29
- Antibodies
- Publication
- Capon et al., 2022 - Endocardial identity is established during early somitogenesis by Bmp signalling acting upstream of npas4l and etv2
- All Figures
- Figures for Capon et al., 2022
|
Fig. 5
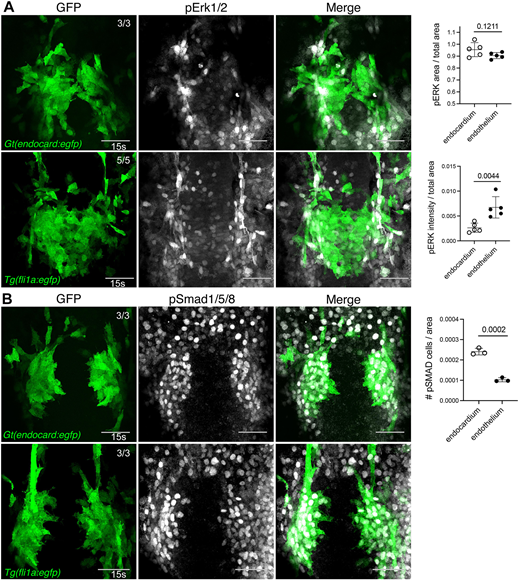
Bmp signalling is active in developing endocardial cells. (A,B) Immunofluorescence staining for pErk1/2 (A) in Gt(endocard:egfp) and Tg(fli1a:egfp) embryos at 15 s shows minimal pErk1/2 signal in endocardial cells and high activity in the adjacent vascular endothelium. By contrast, pSmad1/5/8 (B) in Gt(endocard:egfp) and Tg(fli1a:egfp) embryos at 15 s shows high pSmad1/5/8 activity in developing endocardial cells but minimal activity in adjacent vasculature. Quantification of pErk1/2 area and intensity or pSMAD cell number in endocardium or adjacent vasculature is depicted in neighbouring graphs. Dorsal views are shown with anterior to the top in all images. Scale bars: 50 μm. Data are mean±s.d. P-values are present in graphs (determined by an unpaired two-tailed t-test).