
IMAGE
Fig. 2.
- ID
- ZDB-IMAGE-220509-1
- Publication
- Lukowicz-Bedford et al., 2022 - Connexinplexity: The spatial and temporal expression of connexin genes during vertebrate organogenesis
- All Figures
- Figures for Lukowicz-Bedford et al., 2022
Image
|
Figure Caption
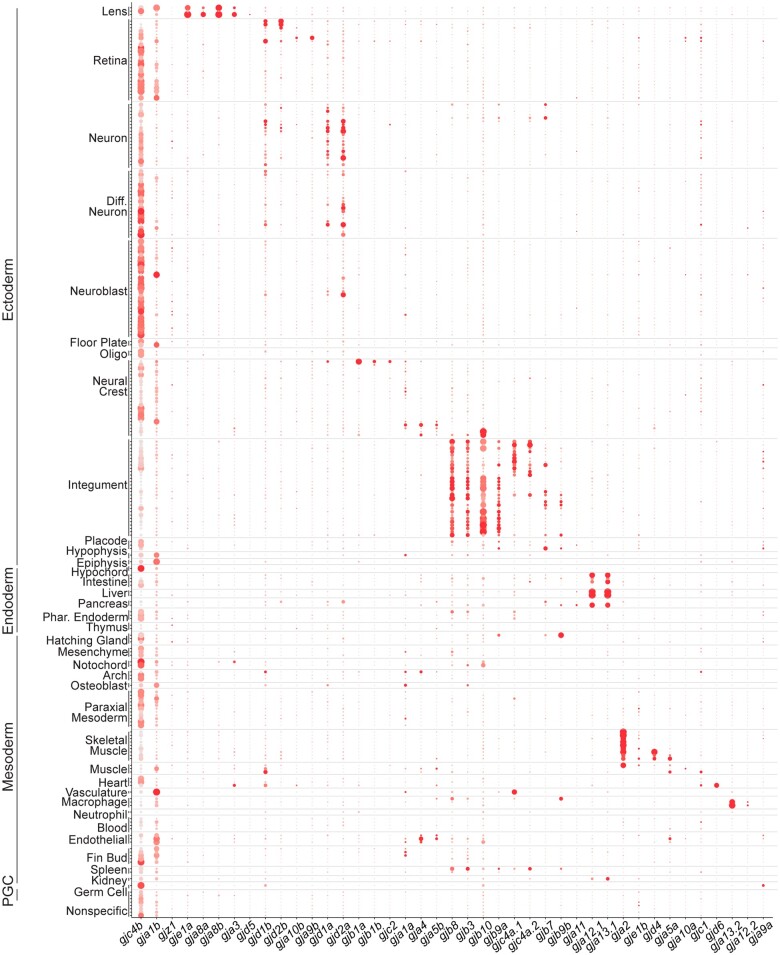
Fig. 2.
Connexin expression during zebrafish organogenesis. Clusters are organized by annotations and grouped into tissues and germ layers denoted on the
Acknowledgments
This image is the copyrighted work of the attributed author or publisher, and
ZFIN has permission only to display this image to its users.
Additional permissions should be obtained from the applicable author or publisher of the image.
Full text @ G3 (Bethesda)