
Image
|
Figure Caption
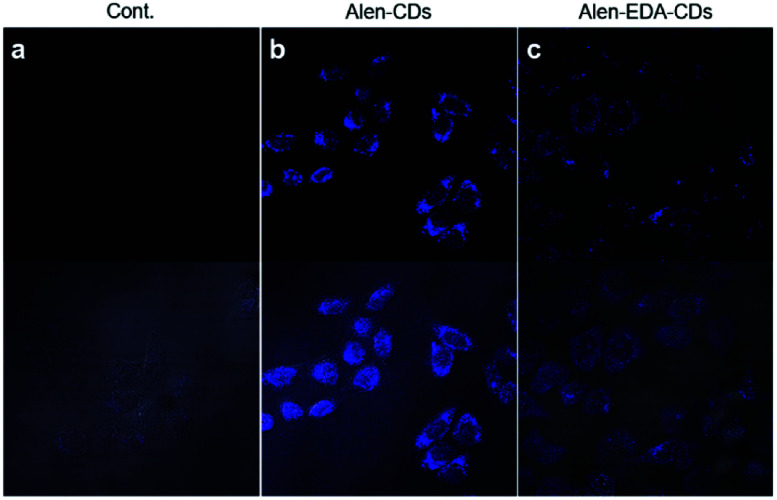
Fig. 4 Confocal microscopy images (60×, ex; 405 nm/em; 440–470 nm) of HeLa cells treated with 300 μg mL−1 Alen-CDs and Alen-EDA-CDs: (a) control group, (b) Alen-CDs, and (c) Alen-EDA-CDs.
Acknowledgments
This image is the copyrighted work of the attributed author or publisher, and
ZFIN has permission only to display this image to its users.
Additional permissions should be obtained from the applicable author or publisher of the image.
Full text @ RSC Adv.