IMAGE

Fig. 9

ID
ZDB-IMAGE-220507-2
Source
Figures for Reichmann et al., 2022
Image
Figure Caption

Fig. 9

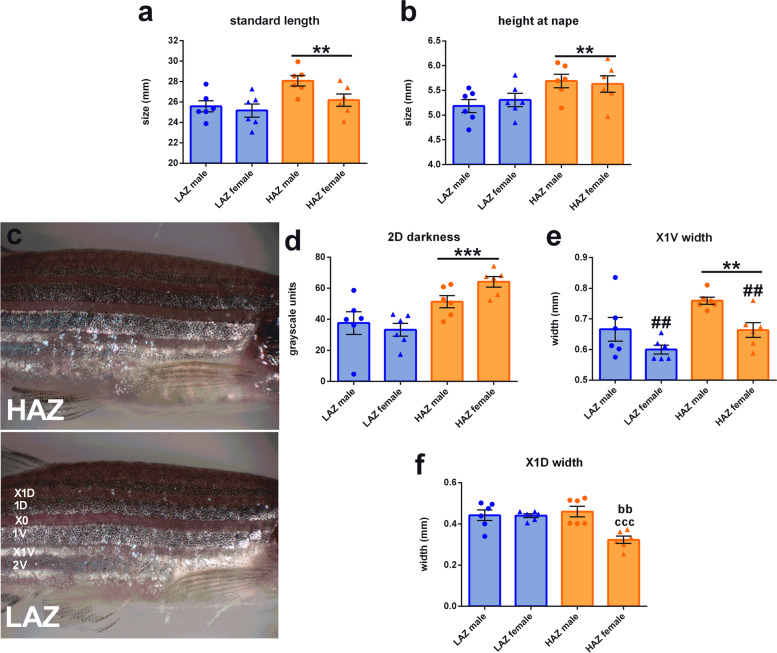
Morphological differences between high aggression zebrafish (HAZ) and low aggression zebrafish (LAZ). a Standard length and b height at nape measurements of male and female HAZ and LAZ exposed to the mirror-induced aggression setup for 1h and used for RNAseq (cohort 2). c Representative stripe pattern images of used HAZ and LAZ. d Stripe colouration of 2D stripes as assessed by grayscale measurements of stereomicroscopic images. (ef Width of X1V and X1D interstripes. Two-way ANOVA followed by Tukey post hoc test in the case of a significant interaction term. n = 6/group. ***, P<0.001; **, P<0.01 main effect HAZ vs. LAZ; bb, P<0.01 vs. LAZ male; ccc, P<0.001 vs. HAZ male. Data are presented as mean ± SEM. Source data and individual data values are available in Additional file 2

Acknowledgments
This image is the copyrighted work of the attributed author or publisher, and ZFIN has permission only to display this image to its users. Additional permissions should be obtained from the applicable author or publisher of the image. Full text @ BMC Biol.