
IMAGE
Figure 4
- ID
- ZDB-IMAGE-220430-215
- Publication
- Bláhová et al., 2022 - Partial fads2 Gene Knockout Diverts LC-PUFA Biosynthesis via an Alternative Δ8 Pathway with an Impact on the Reproduction of Female Zebrafish (Danio rerio)
- All Figures
- Figures for Bláhová et al., 2022
Image
|
Figure Caption
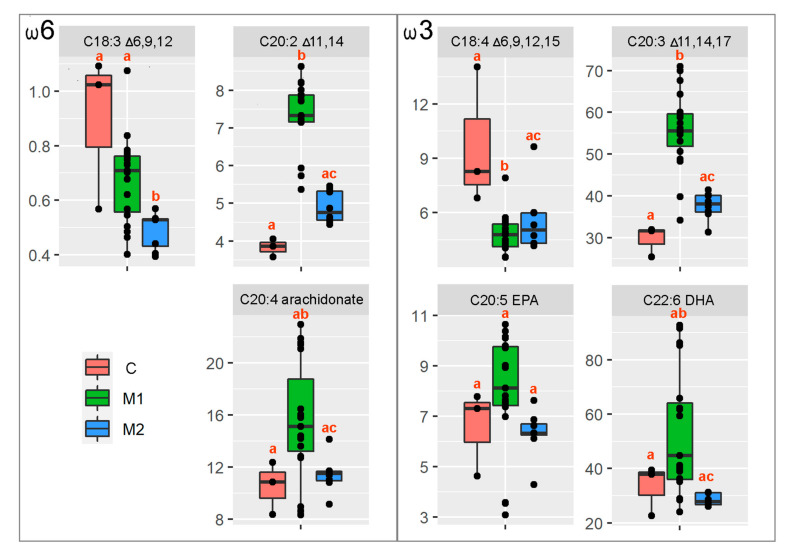
Figure 4
Figure 4. Box and whisker plots for the given LC-PUFA ratio summarizing the median value (black solid horizontal line), first and third quartiles, and minimum and maximum values. The different letters above particular box and whisker plots represent the significant statistical difference among the particular groups.
Figure Data
Acknowledgments
This image is the copyrighted work of the attributed author or publisher, and
ZFIN has permission only to display this image to its users.
Additional permissions should be obtained from the applicable author or publisher of the image.
Full text @ Genes (Basel)