
|
FIGURE 7
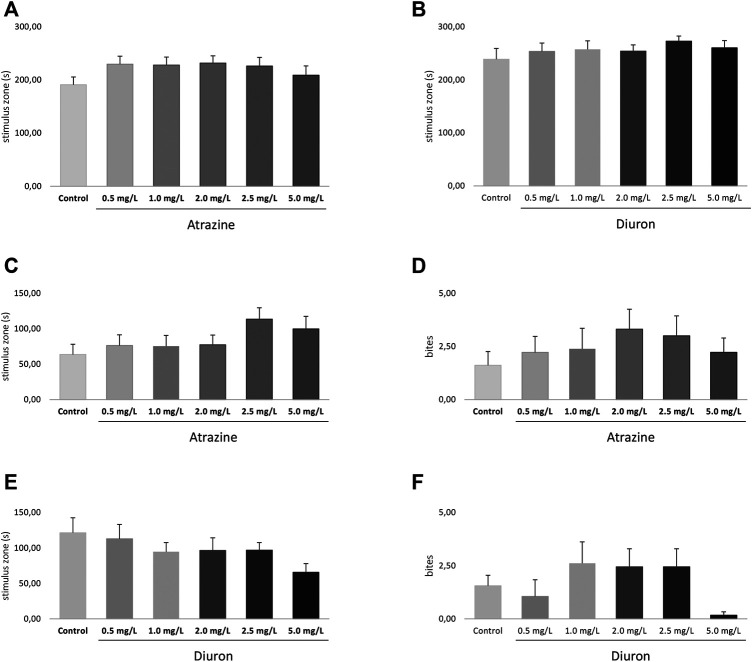
FIGURE 7. Effects of acute exposure to atrazine or diuron on aggression and social interaction in adult zebrafish. Columns depict means ± S.E.M. Sample sizes are n = 18 for each group. (A) Atrazine exposure effects on aggressive behavior estimated by the time spent at the stimulus zone closer to the mirror (s); (B) atrazine exposure effects on the number of bites; (C) diuron exposure effects on aggressive behavior estimated by the time spent at the stimulus zone closer to the mirror (s); (D) diuron exposure effects on the number of bites; atrazine exposure effects on time mobile (s); (E) atrazine exposure effects on social behavior estimated by the time spent at the stimulus zone closer to the mirror (s); (F) atrazine exposure effects on social behavior estimated by the time spent at the stimulus zone closer to the mirror (s). Data were analyzed by one-way ANOVA followed by a post-hoc Tukey’s test.