
|
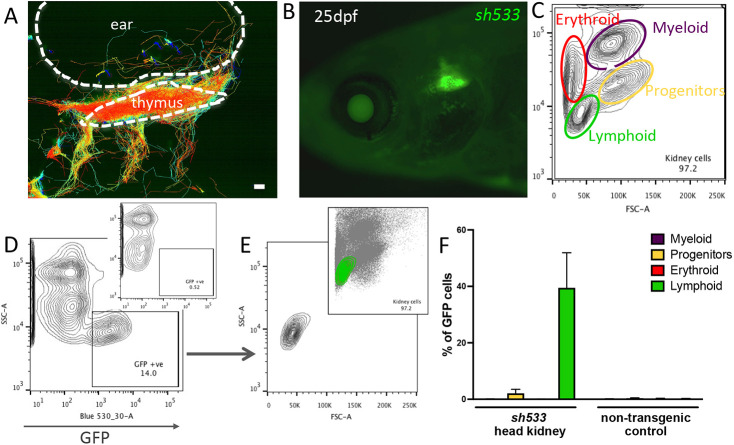
Fig. 4.
zferv1a is expressed in cells from the lymphoid lineage in adult haematopoietic tissues. (A) Cell tracking reveals dynamic behaviour of entry and exit of the thymus by GFP-positive cells in Tg(zferv1a:GFP)sh533. Whole-stack analysis of cell movement using TrackMate in Fiji. Scale bar: 10 µm. (B) Expression of Tg(zferv1a:GFP)sh533 in a 25 dpf zebrafish highlighting the triangular shaped thymus. (C) Forward scatter (FSC)/side scatter (SSC) plot of a whole kidney marrow separating different haematopoietic lineages by size and granularity. (D) SSC and GFP plot from a single-cell suspension of a whole kidney marrow from an adult Tg(zferv1a:GFP) with gate selecting GFP-positive cells. Inset shows the distribution of cells from a non-transgenic adult whole kidney marrow. (E) FSC/SSC plot of selected GFP-positive cells from D. Inset shows the location of the GFP-positive cells in the haematopoietic lineage FSC/SSC plot. (F) Quantification of GFP-positive cells in myeloid, erythroid, lymphoid lineages and progenitors from dissected sh533 and non-transgenic control adult head kidneys (n=3).