IMAGE

FIGURE 3

ID
ZDB-IMAGE-220420-39
Source
Figures for Martins et al., 2022
Image
Figure Caption

FIGURE 3

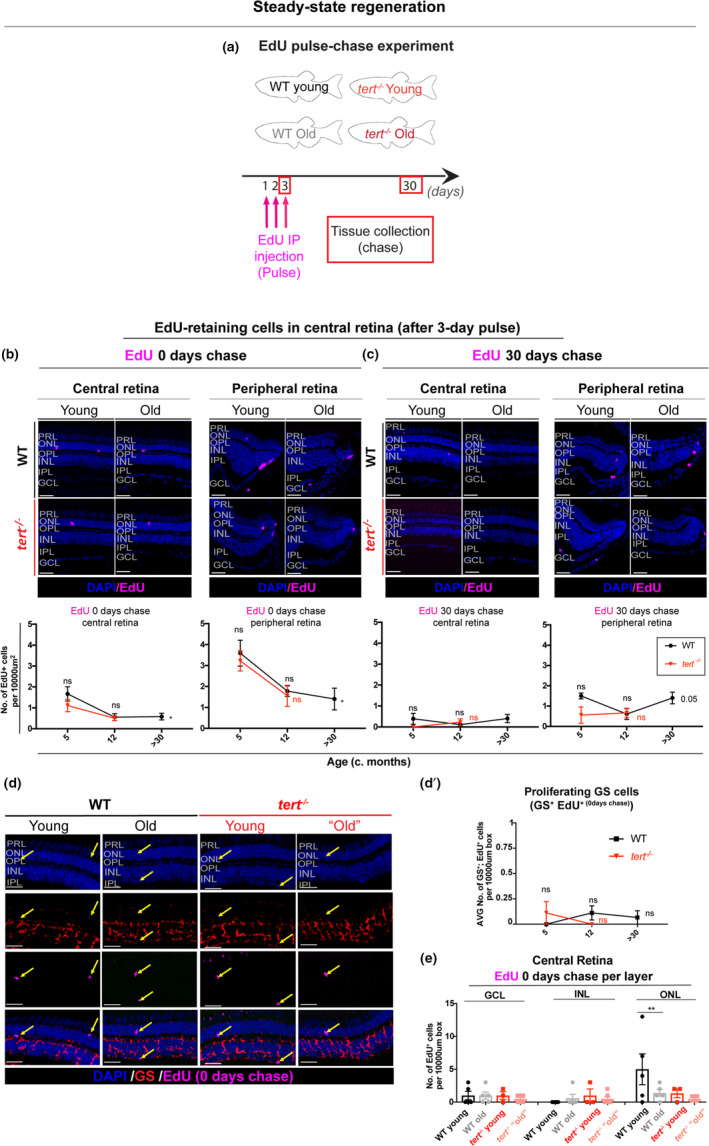
Aged zebrafish retina does not show signs of regeneration in response to spontaneous cell death and neuronal loss. (a) Schematic figure of the experimental design: 3‐day pulse of EdU, by IP injection, followed by 0‐ or 30‐day chase. We anticipate that in a healthy young fish the retina has some cells proliferating in the CMZ, which over‐time will replace older cells in the central retina. In the case of injury, we anticipate that there will be elevated levels of proliferation in peripheral and central retina to replace the dead cells. (b–c) The central and the peripheral retina immunolabelled with EdU (in purple), at (b) 0‐ and (c) 30‐day chase, in both WT and tert−/−, in young (5 months) and old adults (>30 months in WT and 12 months in tert−/−). Scale bars: 20 μm. Graphs show quantifications of the number of EdU‐retaining cells per area (10,000 μm2), in the overall central and peripheral retina at (b) 0‐ and (c) 30‐day chase. (d) The central retina immunolabelled with GS (Müller glia, in red) after a 3‐day pulse of EdU, by IP injection, at 0‐day chase, in both WT and tert−/−, in young (5 months) and old adults (>30 months in WT and 12 months in tert−/−). Scale bars: 20 μm. Yellow arrows show EdU‐positive cells. (d’) Quantifications of the number of GS‐positive; EdU‐positive cells per area (10,000 μm2). Error bars represent SEM. N = 3–6. (e) Quantifications of the number of EdU‐retaining cells per area (10,000 μm2), per layer of the retina, at 0‐day chase. Error bars represent SEM. N = 3–6

Acknowledgments
This image is the copyrighted work of the attributed author or publisher, and ZFIN has permission only to display this image to its users. Additional permissions should be obtained from the applicable author or publisher of the image. Full text @ Aging Cell