
IMAGE
FIGURE 5
- ID
- ZDB-IMAGE-220420-21
- Publication
- Zheng et al., 2022 - Nexmifa Regulates Axon Morphogenesis in Motor Neurons in Zebrafish
- All Figures
- Figures for Zheng et al., 2022
Image
|
Figure Caption
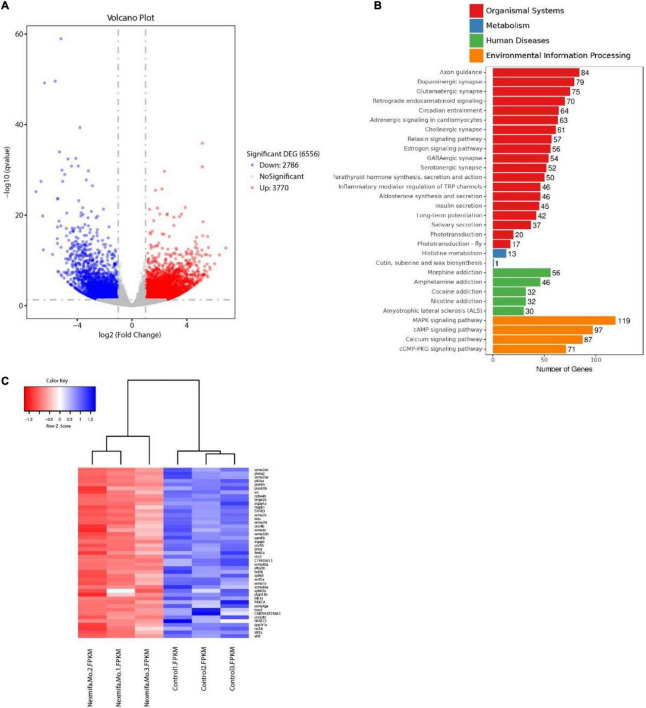
FIGURE 5
Transcriptomics profiling in nexmifa morphant and wild-type zebrafish.
Acknowledgments
This image is the copyrighted work of the attributed author or publisher, and
ZFIN has permission only to display this image to its users.
Additional permissions should be obtained from the applicable author or publisher of the image.
Full text @ Front. Mol. Neurosci.