
|
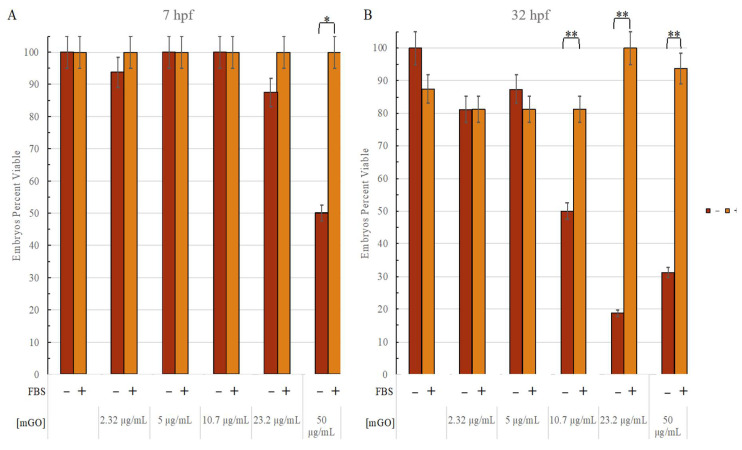
Figure 8 Figure 8. UP + mGO toxicity compared to FBS + mGO toxicity for 26 hpf. Red bars indicate the percent viability for the embryos that were exposed to mGO alone; orange bars indicate the percent viability for mGO + 4% FBS-exposed embryo. Concentrations found below the UP and FBS groups indicate the increasing mGO concentration in the solution (0 μg/mL, 2.32 μg/mL, 5 μg/mL, 10.7 μg/mL, 23.2 μg/mL, 50 μg/mL). Minor lines on the y-axis indicate a 5% change. (A) There was a significant difference between the mGO-only group and the FBS + mGO group at the highest concentration (50 μg/mL) 1 h post-exposure (7 hpf). (B) The 32 hpf magnifies the trends that were starting to appear at 7 hpf. As observed in the range-finding portion of this study, 10.7 μg/mL was the LEL in the embryos exposed to mGO only. On the other hand, this effect was not reflected in the embryos exposed to the FBS mixture. *: p ≤ 0.01. **: p ≤ 0.001.