
|
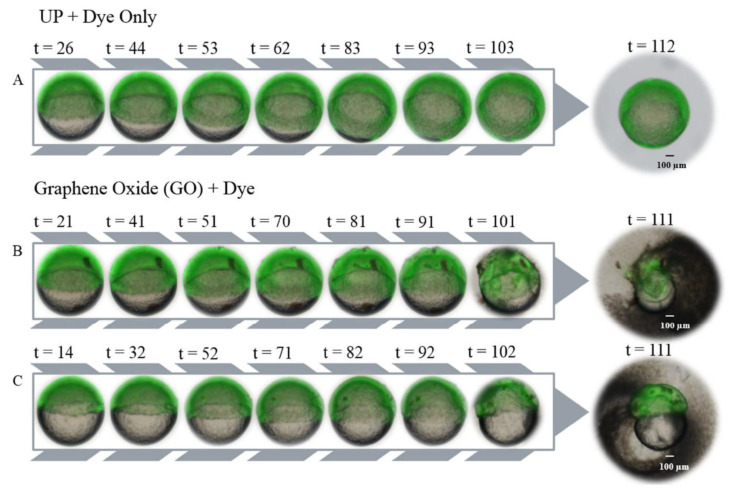
Figure 7 Figure 7. ROS fluorescence imaging of mGO and UP water control embryos. After DCF-DA incubation for 30 min, 6 hpf embryos were exposed to 50 μg/mL mGO or UP water and imaged every 10 min. (A) Representative embryo in UP water. The embryo oriented itself so that yolk sac was no longer visible after 83 min post-exposure. (B) Embryos exposed to mGO. Observed accumulation of GO particles on the surface of the embryo. Yolk content loss is visible in later timepoints of the images. (C) Another embryo exposed to mGO. We can see the accumulation of GO particles on the surface of the embryo. t = minutes post-exposure.