
Figure 5
- ID
- ZDB-IMAGE-220416-72
- Publication
- Tonon et al., 2022 - 5-Azacytidine Downregulates the Proliferation and Migration of Hepatocellular Carcinoma Cells In Vitro and In Vivo by Targeting miR-139-5p/ROCK2 Pathway
- All Figures
- Figures for Tonon et al., 2022
|
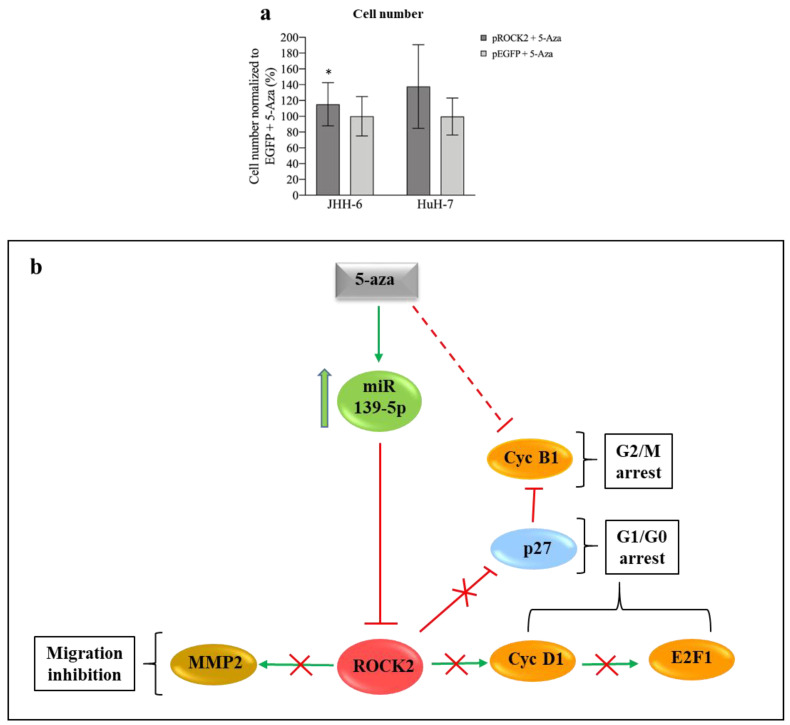
Figure 5 Figure 5. Phenotypic effects of ROCK2 overexpression/downregulation and miR-139-5p/ROCK2 pathway. (a) ROCK2 overexpression and 5-Aza treatment. Left: data in %, normalized to the average of JHH-6 overexpressing EGFP (enhanced green fluorescent protein, control cells) + 5-Aza treatment (0.8 μM), are expressed as mean ± SEM, n = 4; JHH-6 overexpressing ROCK2 + 5-Aza vs. JHH-6 overexpressing EGFP + 5-Aza, * p = 0.035. Right: HuH-7 overexpressing ROCK2 + 5-Aza vs. HuH-7 overexpressing EGFP + 5-Aza (6 μM); data in %, normalized to the average of HuH-7 overexpressing EGFP + 5-Aza, are expressed as mean ± SEM, n = 3. (b) Molecular pathways regulated by miR-139-5p and effects on cell migration and proliferation: 5-Aza upregulates miR-139-5p, which in turn leads to the downregulation of ROCK2/cyclin D1/E2F1/cyclin B1/MMP-2 and the upregulation of p27kip1; this results in G1/G0-G2/M cell cycle arrest and in the impairment of cell migration.