
Image
|
Figure Caption
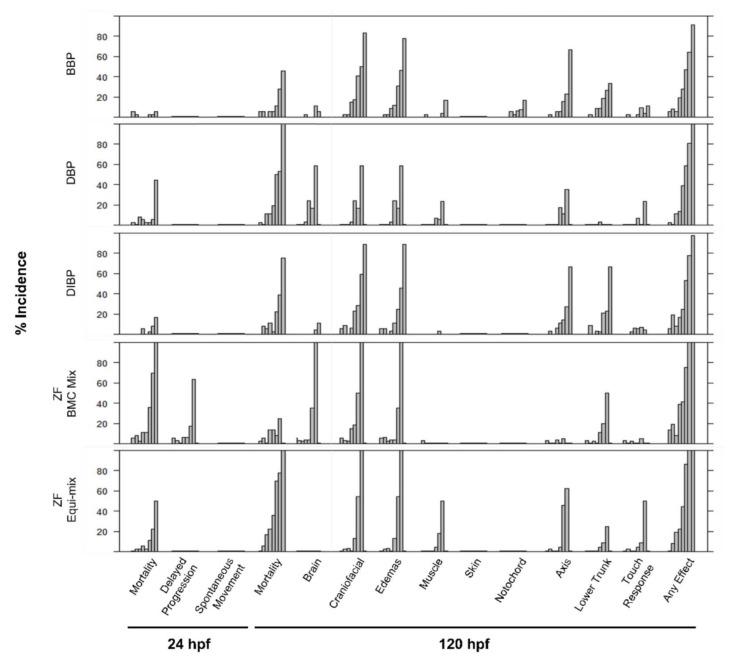
Figure 4 Figure 4. Concentration–response bar plots for incidence of each morphological endpoint from zebrafish bioactivity screening for individual phthalates and equimolar and BMC-based phthalate mixtures. Concentrations across the y-axis for each chemical and mixture are listed in Table 4.
Acknowledgments
This image is the copyrighted work of the attributed author or publisher, and
ZFIN has permission only to display this image to its users.
Additional permissions should be obtained from the applicable author or publisher of the image.
Full text @ Int. J. Environ. Res. Public Health