
|
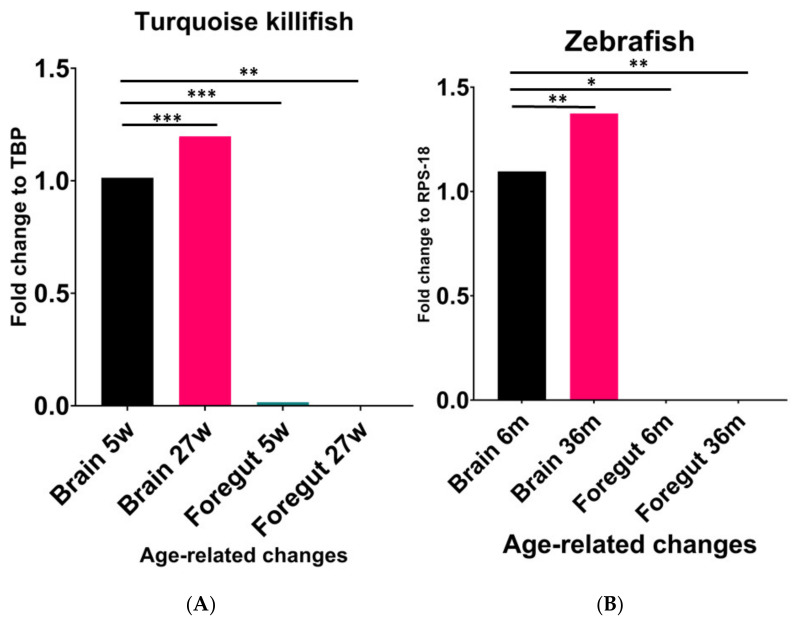
Figure 1 Figure 1. Comparative expression levels of NPY mRNA in the brain and foregut of young and old turquoise killifish (A) and zebrafish (B). (A) Significant increase in NPY mRNA in the brain of 27 wph animals compared to 5 wph ones. Higher expression levels in the brain of animals at 5 wph compared to the levels detected in the foregut of the same animals. (B) Significant increase in NPY mRNA in the brain of 36-month-old zebrafish compared to 6-month-old animals. Significant decrease in the foregut compared to the brain either in young or old specimens. * (p < 0.5), ** (p < 0.05), *** (p < 0.001).