
|
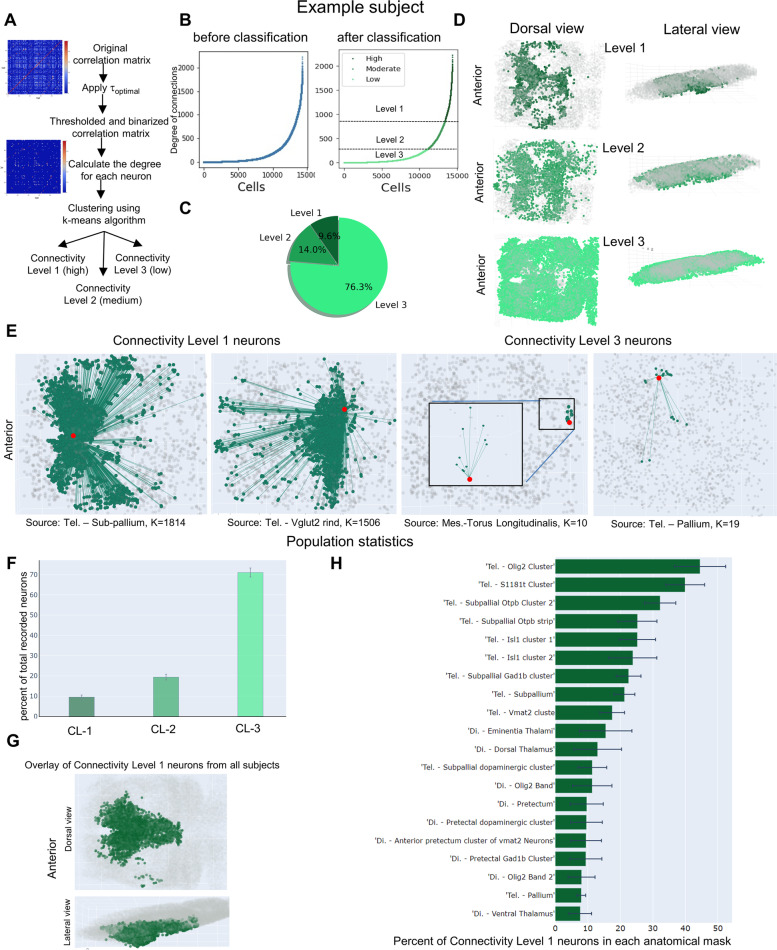
Fig. 2 Classification of neurons based on their degree of functional connections. A Overview of the classification of individual ROIs (neurons) based on their level of functional connectivity (degree). The Pearson correlation coefficient was used to calculate the correlation matrix, which was then thresholded using the optimal threshold value. The k-means clustering algorithm was used to cluster ROIs based on their degree. B Sorted ROIs (left) vs. clustered ROIs (right) based on their functional connectivity level for an example subject. C Pie chart showing the percentage of ROIs in three connectivity level categories for an example subject. The ROIs with the highest level of functional connectivity is the smallest group (around than 8%). D Dorsal and lateral views of the three connectivity categories of ROIs’ distributions in the example subject's forebrain. E The connectivity of ROIs with the connectivity levels 1 and 3 in the example subject brain. F Percent of total recorded neurons in each functional connectivity level across 9 subjects. G Overlay view of highly functional connected ROIs (level 1) in all 9 subjects shows that they are located in the medial part of the forebrain. H Anatomical distribution of connectivity level 1 neurons sorted based on the percentage of total recorded neurons in each anatomical mask. The number of replicates used is 9