
Figure 2
- ID
- ZDB-IMAGE-220416-15
- Publication
- Chen et al., 2022 - Relationship between Neuroprotective Effects and Structure of Procyanidins
- All Figures
- Figures for Chen et al., 2022
|
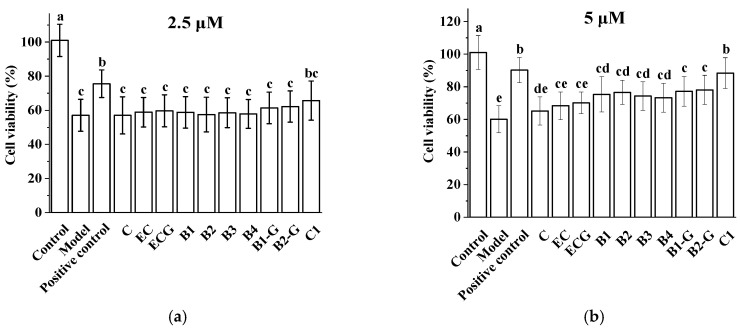
Figure 2 Effect of different procyanidins on the survival of PC12 cells induced by H2O2. (a) Effect of 2.5 μM procyanidins on the survival of PC12 cells induced by H2O2; (b) Effect of 5 μM procyanidins on the survival of PC12 cells induced by H2O2. Control, Blank control group; Model. H2O2 (200 μM); Positive control, NAC (20 μM) + H2O2 (200 μM); C, C + H2O2 (200 μM); EC, EC + H2O2 (200 μM); ECG, ECG + H2O2 (200 μM); B1, B1 + H2O2 (200 μM); B2, B2 + H2O2 (200 μM); B3, B3 + H2O2 (200 μM); B4, B4 + H2O2 (200 μM); B1-G, B1-G + H2O2 (200 μM); B2-G, B2-G + H2O2 (200 μM); C1, C1 + H2O2 (200 μM). Data are expressed as the mean ± SD. All experiments were conducted six times. Values with different letters above each bar represent significant differences (p < 0.05, one-way ANOVA). NAC, N-acetyl-l-cysteine.