
IMAGE
Figure 5
- ID
- ZDB-IMAGE-220416-1
- Publication
- Garg et al., 2022 - A Markerless Pose Estimator Applicable to Limbless Animals
- All Figures
- Figures for Garg et al., 2022
Image
|
Figure Caption
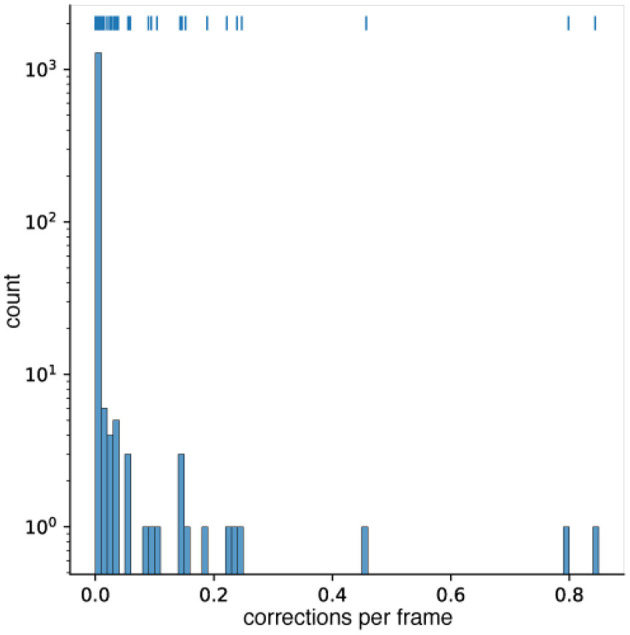
Figure 5
A histogram of the correction frequency per frame for 1,318 different zebrafish video. 1,176 videos needed no correction at all. In 107 videos, less than 5% of the frames were corrected. Note that the counts are depicted on a logarithmic scale. Above the histogram bars, a rug plot (similar to a scatter plot) of the occurrences is given. Each vertical marker represents a video at the given correction frequency on the x-axis.
Acknowledgments
This image is the copyrighted work of the attributed author or publisher, and
ZFIN has permission only to display this image to its users.
Additional permissions should be obtained from the applicable author or publisher of the image.
Full text @ Front. Behav. Neurosci.