
IMAGE
Figure 5
- ID
- ZDB-IMAGE-220413-12
- Publication
- Lama et al., 2022 - Zebrafish as a Vertebrate Model for Studying Nodavirus Infections
- All Figures
- Figures for Lama et al., 2022
Image
|
Figure Caption
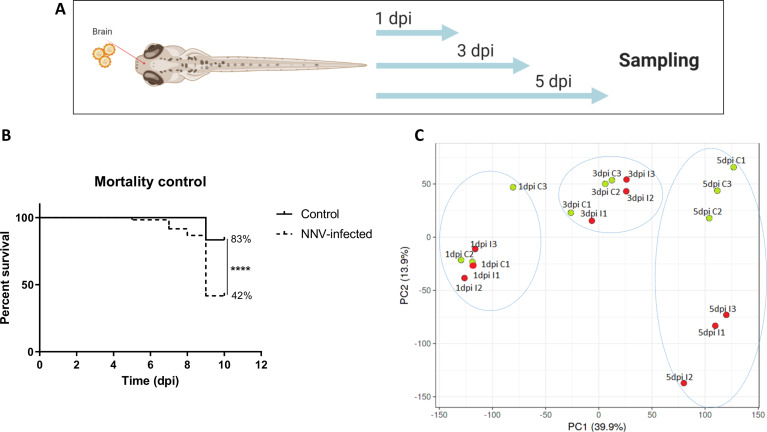
Figure 5
Transcriptome analysis of 3-dpf zebrafish larvae infected with NNV
Acknowledgments
This image is the copyrighted work of the attributed author or publisher, and
ZFIN has permission only to display this image to its users.
Additional permissions should be obtained from the applicable author or publisher of the image.
Full text @ Front Immunol