
Image
|
Figure Caption
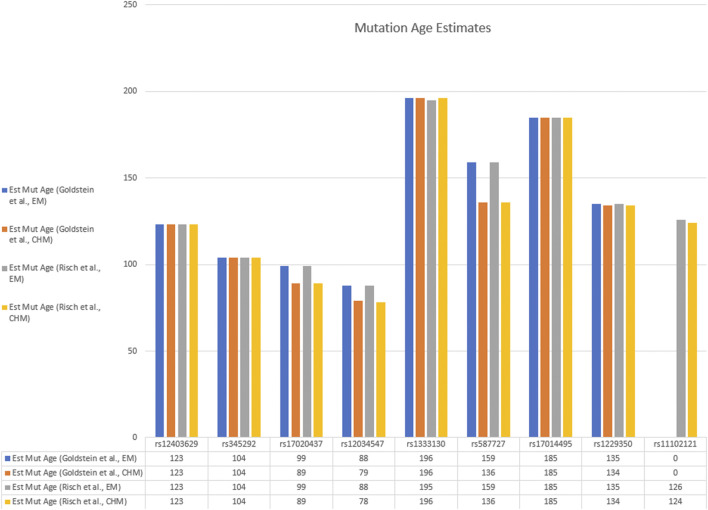
FIGURE 3
Bar graph of estimated mutation ages from various haplotype blocks by the Goldstein and Risch methods. Data are taken from
Acknowledgments
This image is the copyrighted work of the attributed author or publisher, and
ZFIN has permission only to display this image to its users.
Additional permissions should be obtained from the applicable author or publisher of the image.
Full text @ Front Genet