
IMAGE
Fig. 4
- ID
- ZDB-IMAGE-220409-4
- Publication
- Monroe et al., 2022 - Identification of novel lipid biomarkers in xmrk- and Myc-induced models of hepatocellular carcinoma in zebrafish
- All Figures
- Figures for Monroe et al., 2022
Image
|
Figure Caption
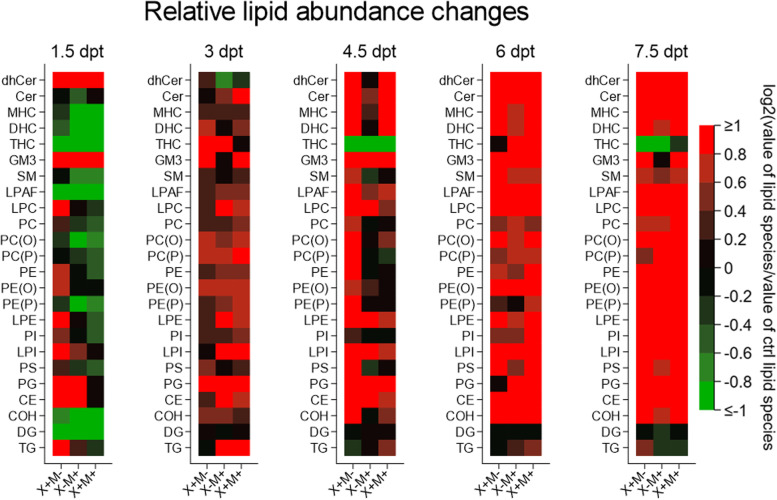
Fig. 4
Relative lipid class abundance changes in zebrafish liver tumor tissue. Abundance of 24 lipid classes in three mpf DOX-treated zebrafish from 1.5 to 7.5 dpt (see text for lipid class abbreviation definition). Key: x+m−,
Figure Data
Acknowledgments
This image is the copyrighted work of the attributed author or publisher, and
ZFIN has permission only to display this image to its users.
Additional permissions should be obtained from the applicable author or publisher of the image.
Full text @ Cancer Metab