
Image
|
Figure Caption
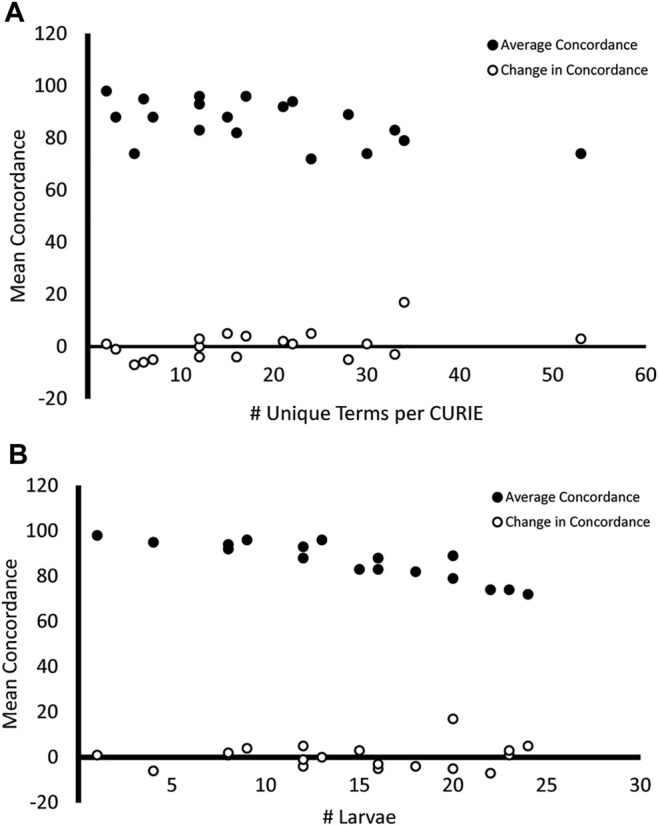
FIGURE 7
Mean concordance and variability in endpoint reporting. Endpoints that were described using a higher number of unique terms
Acknowledgments
This image is the copyrighted work of the attributed author or publisher, and
ZFIN has permission only to display this image to its users.
Additional permissions should be obtained from the applicable author or publisher of the image.
Full text @ Front Toxicol