IMAGE

Figure 4

ID
ZDB-IMAGE-220407-4
Source
Figures for Arslan et al., 2022
Image
Figure Caption

Figure 4

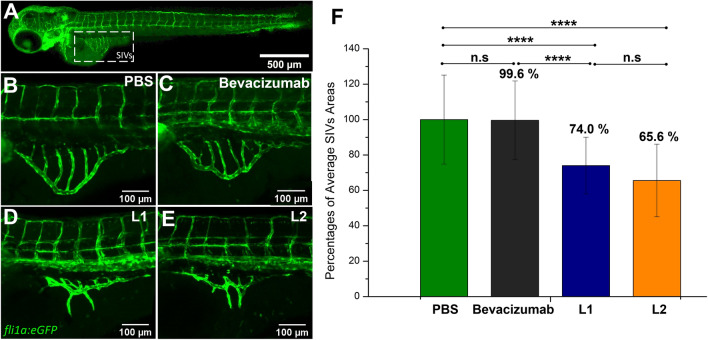
In vivo angiogenesis inhibition by L1, L2 and bevacizumab. (A) Lateral view of subintestinal vessels (SIVs) in fli1:EGFP transgenic zebrafish larvae at 3 dpf. (B) PBS (negative control) (C) 27.5 μM bevacizumab (D) 55 μM L1, (E) 55 μM L2 were injected into yolk of 2 dpf fli1:EGFP transgenic zebrafish embryos. At 3 dpf, zebrafish SIVs were imaged by confocal microscopy. (F) Percentages of average SIV areas were quantified. The outcomes are expressed as AVG ± SD. nPBS = 25, nbevacizumab = 24, nL1 = 24, nL2 = 23. Statistical analysis was performed using one-tail t-test. Statistical results: n.s. p > 0.05, ****p < 0.0001.

Acknowledgments
This image is the copyrighted work of the attributed author or publisher, and ZFIN has permission only to display this image to its users. Additional permissions should be obtained from the applicable author or publisher of the image. Full text @ Sci. Rep.