
Image
|
Figure Caption
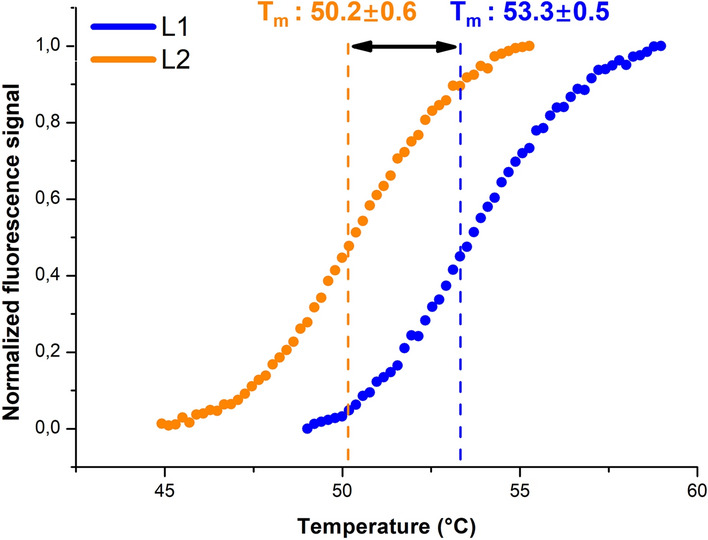
Figure 2
Thermal melting temperatures of L1 and L2. Transition mid-points (Tm values) from fluorescent thermal melt assays were calculated by Hill equation fit. The assay was repeated 3 times.
Acknowledgments
This image is the copyrighted work of the attributed author or publisher, and
ZFIN has permission only to display this image to its users.
Additional permissions should be obtained from the applicable author or publisher of the image.
Full text @ Sci. Rep.