
|
FIGURE 2
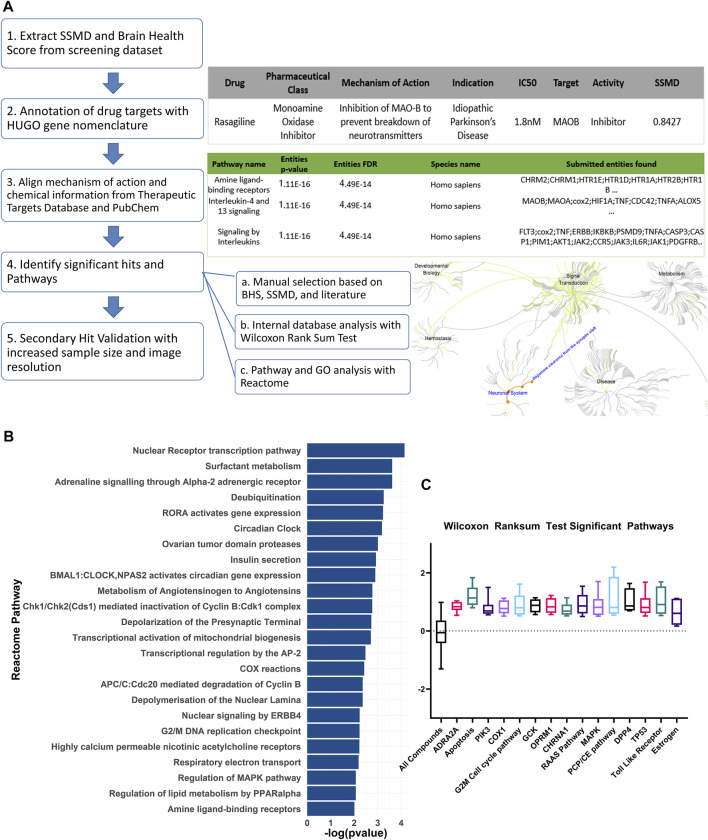
FIGURE 2. Curation and pathway analysis of the screening dataset identify novel mechanisms of neuroprotection. (A) Schematic showing the data processing and analysis pipeline. The example output of the annotations are shown on the right side with the corresponding numbers of each step. Hit calling was based on three criteria, including manual selection with good BHS and SSMD score, Wilcoxon rank sum test, and Reactome pathway analysis. (B) A list of significant pathways from the Reactome pathway analysis sorted from highest to lowest significance (Padj <0.01). (C) Significant pathways from the non-topology-based pathway analysis of the screening dataset. BHS of the chemicals in the same pathway were compared against BHS of all compounds in the dataset. (n = 5 to 13; Padj <0.05, Wilcoxon rank sum test). ADRA2A: Alpha-2A adrenergic receptor, PIK3: Phosphoinositide 3-kinase, COX1: Cytochrome c oxidase subunit I, OPRM1: Mu type opioid receptor, CHRNA1: Cholinergic Receptor Nicotinic Alpha 1 Subunit, RAAS: Renin angiotensin system, MAPK: Mitogen-activated protein kinase, PCP/CE: Planar cell polarity and convergent extension, DPP4: Dipeptidyl peptidase-4, TP53: Tumor protein P53.