
Fig. 5
- ID
- ZDB-IMAGE-220404-5
- Antibodies
- Publication
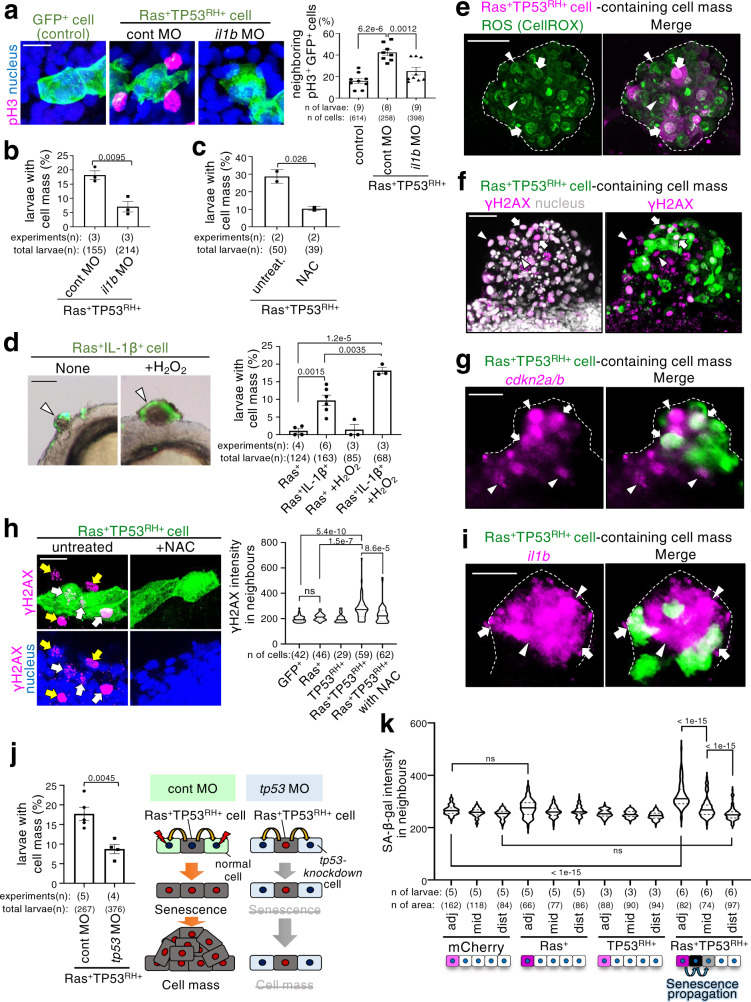
- Haraoka et al., 2022 - Zebrafish imaging reveals TP53 mutation switching oncogene-induced senescence from suppressor to driver in primary tumorigenesis
- All Figures
- Figures for Haraoka et al., 2022
|
Fig. 5