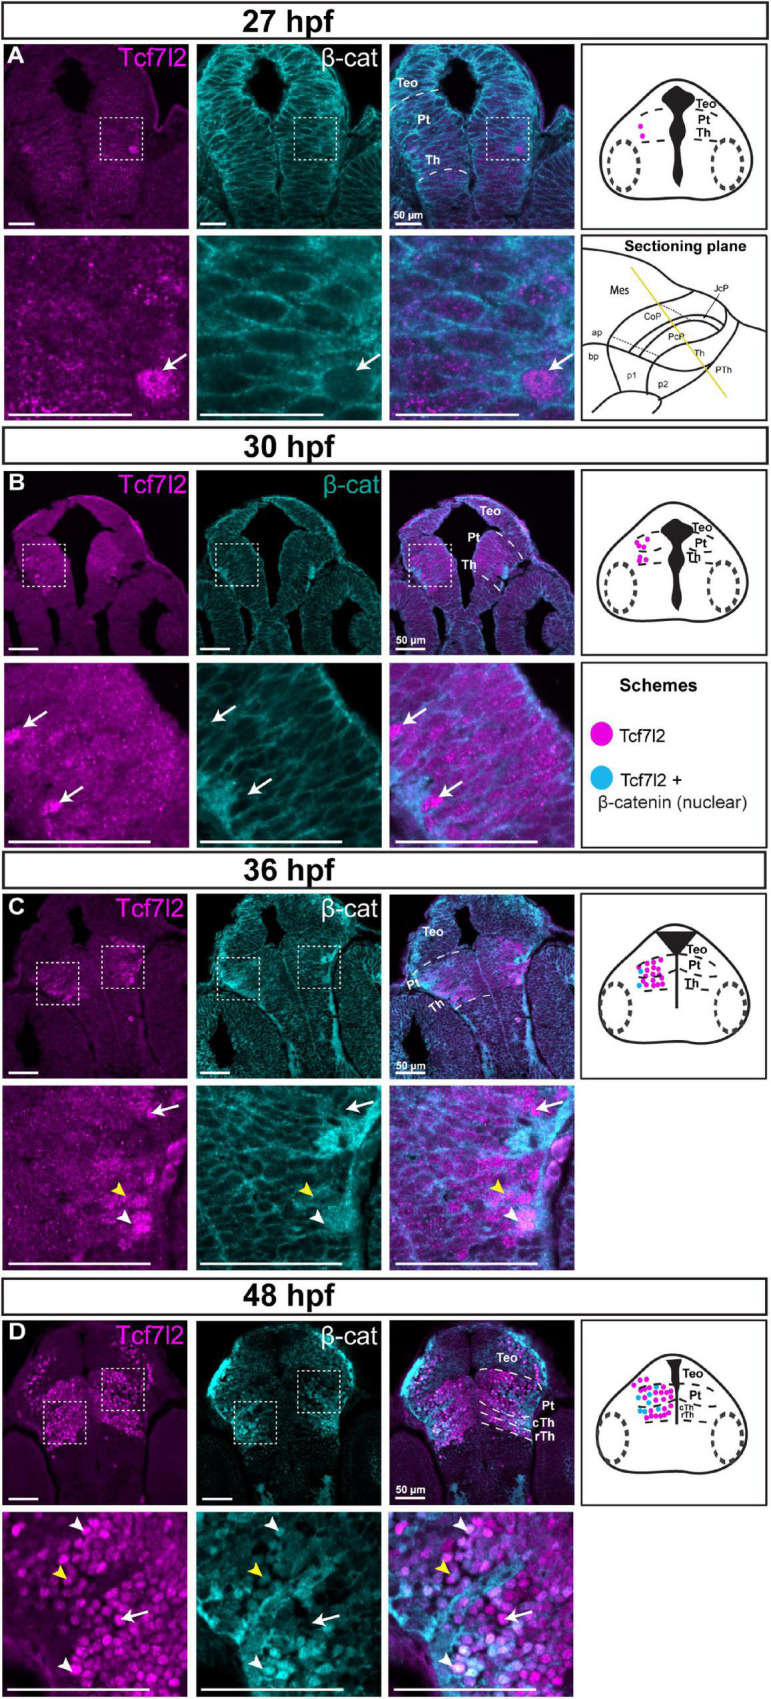
IMAGE

FIGURE 6

ID
ZDB-IMAGE-220402-25
Source
Figures for Brożko et al., 2022
Image
Figure Caption

FIGURE 6

Spatiotemporal expression and subcellular localization of β-catenin in the brain of zebrafish embryos (27–48 hpf). Images showing brain sections from different developmental stages immunostained with antibodies specific for Tcf7l2 and β-catenin. (A,B) 27 and 30 hpf: Tcf7l2 is present in a few cells in the diencephalon mantle zone, while the β-catenin protein is localized only in cell membranes throughout the diencephalon. (C) 36 hpf: Tcf7l2-positive cells are present throughout the Th and Pt with high Tcf7l2 signal in the mantle zone; β-catenin is localized in cell membranes in the ventricular/periventricular area while its subcellular localization in the diencephalon mantle zone is not clear. (D) 48 hpf: Tcf7l2- positive cells are visible throughout the Th and Pt; β-catenin is localized in cell nuclei in the cTh and Pt, being high in superficial areas. Yellow lines show the sectioning plane of the sagittal sections in (A–D). White arrowheads indicate Tcf7l2-positive cells with high level of nuclear β-catenin, yellow arrowheads indicate Tcf7l2-positive cells with low level of nuclear β-catenin, white arrows indicate Tcf7l2-positive cells with no β-catenin in the nuclei. The schemes represent the spatiotemporal distribution of Tcf7l2-positive (magenta dots), and Tcf7l2-positive cells with nuclear β-catenin (blue dots) cells. Pt, pretectum; TeO, optic tectum; Th, thalamus; cTh, caudal thalamus; rTh, rostral thalamus.

Acknowledgments
This image is the copyrighted work of the attributed author or publisher, and ZFIN has permission only to display this image to its users. Additional permissions should be obtained from the applicable author or publisher of the image. Full text @ Front. Neuroanat.