
|
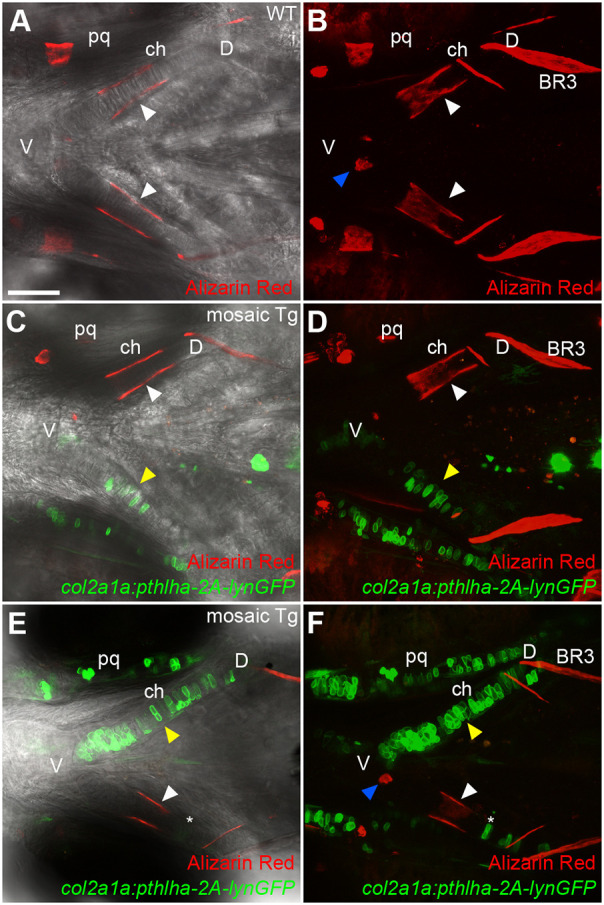
Fig. 5.
Mosaic pthlha misexpression in ch cartilage disrupts ch ossification patterns. (A-F) Live imaging of 144 hpf wild-type (A,B) and col2a1a:pthlha-2A-lynGFP mosaic transgenic (C-F) embryos treated with Alizarin Red. (A,C,E) Optical slices in DIC. (B,D,F) z-projections. White arrowheads indicate the position of the HZ. Yellow arrowheads indicate the position of col2a1a:pthlha-2A-lynGFP-expressing cells. Blue arrowheads indicate the position of the secondary hypertrophic HZ. Asterisks indicate the position of a col2a1a:pthlha-2A-lynGFP-labeled cell disrupting bone collar formation. BR3, branchiostegal ray 3; ch, ceratohyal; D, dorsal; pq; palatoquadrate; V, ventral. All micrographs are ventral views with anterior to the left. Scale bar: 50 μm (A-F).