IMAGE

Fig. 6.

ID
ZDB-IMAGE-220331-14
Source
Figures for Kugler et al., 2022
Image
Figure Caption

Fig. 6.

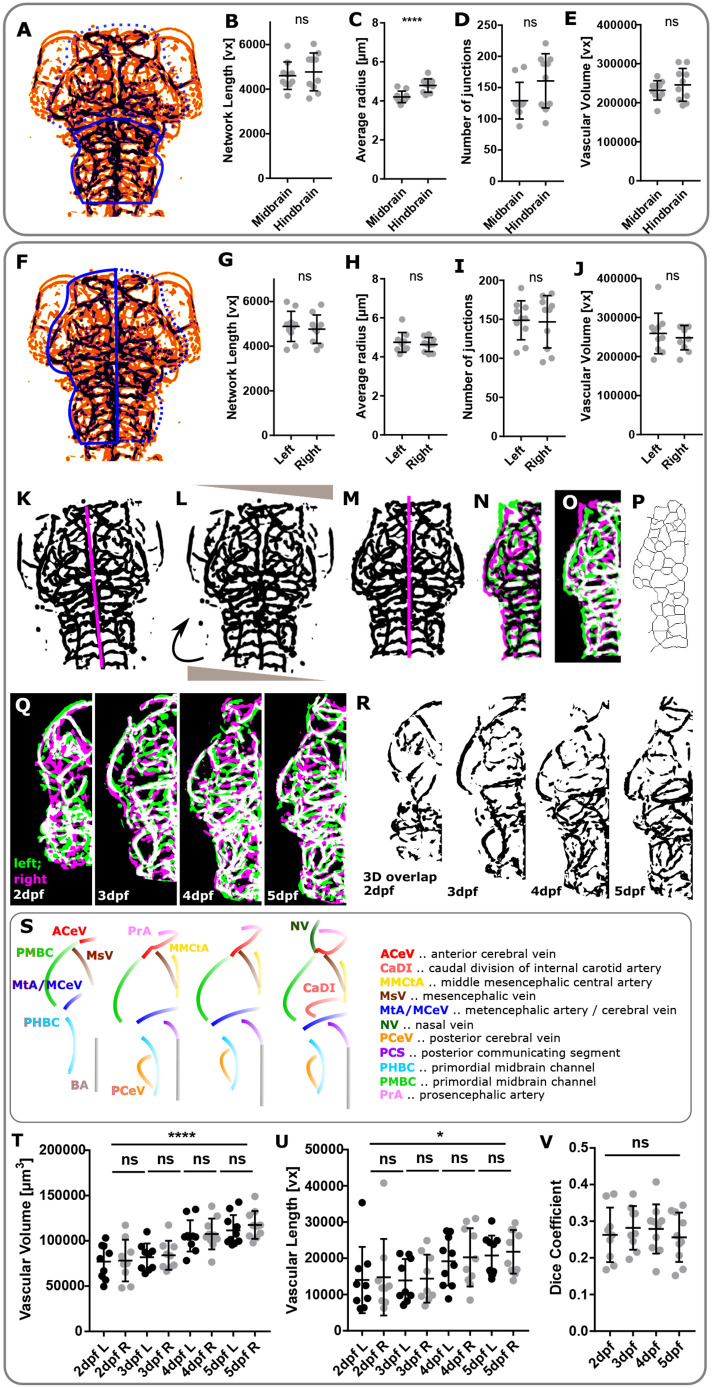
Comparing regional similarity and left-right symmetry. (A) ROI selection allows comparison of vascular parameters in the midbrain (dotted line) and hindbrain (solid line). (B) Comparing the midbrain to the hindbrain, network length was not statistically significantly different (P=0.6168, n=10, unpaired two-tailed Student's t-test; data are mean±s.d.). (C) The average vessel radius was statistically significantly higher in the hindbrain (P=0.0008, n=10, unpaired two-tailed Student's t-test; data are mean±s.d.). (D) The number of junctions was not statistically significantly different (P=0.0717, n=10, unpaired two-tailed Student's t-test; data are mean±s.d.). (E) Vascular volume was not statistically significantly different (P=0.3698, n=10, unpaired two-tailed Student's t-test; data are mean±s.d.). (F) ROI selection allows comparison of vascular parameters in the right (broken line) and left (solid line) brain hemisphere. (G) Comparing the left and right vasculature, network length was not statistically significantly different (P=0.6830, n=10, unpaired two-tailed Student's t-test; data are mean±s.d.). (H) The average vessel radius was not statistically significantly different (P=0.5665, n=10, unpaired two-tailed Student's t-test; data are mean±s.d.). (I) The number of junctions was not statistically significantly different (P=0.8816, n=10, unpaired two-tailed Student's t-test; data are mean±s.d.). (J) Vascular volume was not statistically significantly different (P=0.5730, n=10, unpaired two-tailed Student's t-test; data are mean±s.d.). (K) Manual selection of left-right body axis (magenta) in segmented template fish used for image rotation and left-right separation in registered segmented images. (L) Image rotation was performed to align sample anterior-posterior axis with image x-axis. (M) Right vascular volume was mirrored and vascular volume quantified for the left and right vasculature. (N,O) Similarity measures were extracted to compare left and mirrored right vasculature. (P) Left and right vascular network lengths were quantified after skeletonisation to extract vascular centrelines (representative images). (Q) MIPs of left (green) and right (magenta) vasculature, showing regions of similarity (white). (R) Representative micrographs of regions of left-right vascular overlap from one example fish. (S) Schematics showing left-right symmetric vessels from 2 to 5 dpf. (T) Cranial vascular volume was found to statistically significantly increase from 2 to 5 dpf (****P<0.0001), while no statistically significant difference was found between the vascular volume of the left (L) and right (R) brain hemispheres (L-R; 2 dpf, P<0.9999, n=9 embryos; 3 dpf, P>0.9999, n=9 embryos; 4 dpf, P>0.9999, n=9 embryos; 5 dpf, P=0.9946, n=10 embryos; two experimental repeats; one-way ANOVA; data are mean±s.d.). (U) Cranial vascular network length was found to statistically significantly increase from 2 to 5 dpf (*P=0.0194), while no statistically significant L-R difference was found (L-R; 2 dpf, P<0.9999; 3 dpf, P>0.9999; 4 dpf, P>0.9999; 5 dpf, P>0.9999; n values as above; Kruskal–Wallis test; data are mean±s.d.). (V) The Dice co-efficient was not statistically significantly changed between the left and right vasculature from 2 to 5 dpf (P=0.8058; one-way ANOVA; 2 dpf, n=9 embryos; 3 dpf, n=9 embryos; 4 dpf, n=10 embryos; 5 dpf, n=10 embryos; data are from two experimental repeats; data are mean±s.d.).

Acknowledgments
This image is the copyrighted work of the attributed author or publisher, and ZFIN has permission only to display this image to its users. Additional permissions should be obtained from the applicable author or publisher of the image. Full text @ Development