IMAGE

Fig. 4

ID
ZDB-IMAGE-220328-8
Source
Figures for Kuang et al., 2022
Image
Figure Caption

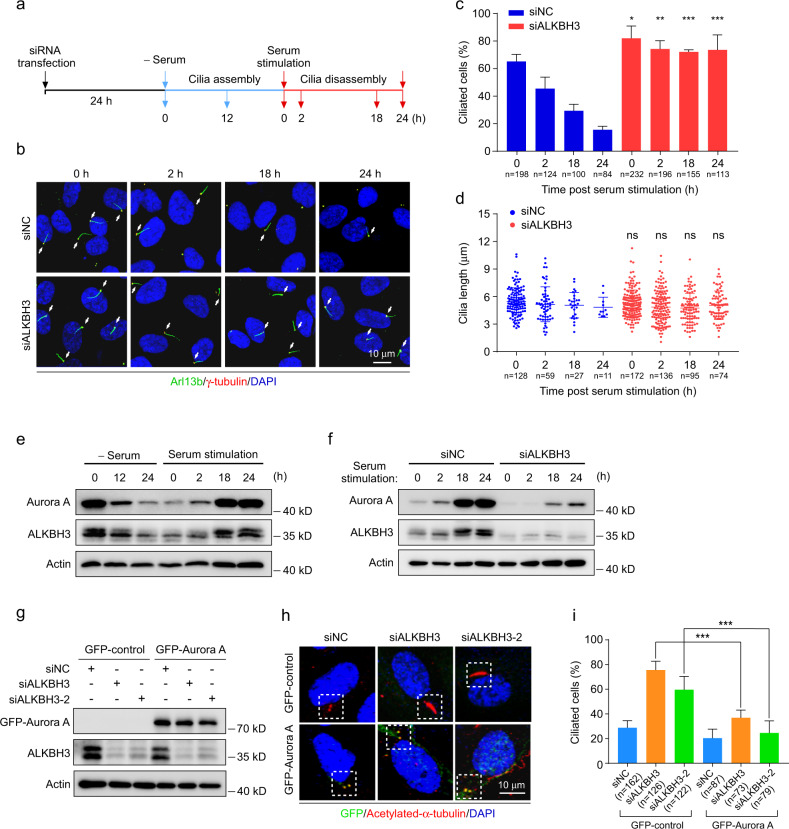
Fig. 4 Ectopic expression of Aurora A reverses the ciliary defects in ALKBH3-depleted cells.

af RPE-1 cells transfected with the indicated siRNAs or not were treated with serum starvation for 24 h and serum stimulation for another 24 h, and then subjected to the following analyses at the indicated time points. Schematic illustration of experimental strategy used for the cilia assembly and disassembly experiments (a). Representative confocal images of RPE-1 cells with anti-Arl13b (green) and γ-tubulin (red) antibodies (b). Cilia are indicated by white arrows. Quantification analysis of the percentage of ciliated cells (c). Cilia length was determined by Image J software (d). Western blotting analysis of Aurora A and ALKBH3 proteins at the indicated time points (e, f). Actin was served as a loading control. gi RPE-1 cells treated with the indicated siRNAs for 24 h, followed by infection with lentivirus carrying GFP-control or GFP-Aurora A for another 48 h in normal conditions, and then subjected to western analysis or immunofluorescence. Western blotting of GFP-Aurora A and ALKBH3 protein. Actin, a loading control (g). Representative confocal images of RPE-1 cells with anti-GFP (green) and anti-acetylated-α-tubulin (red) antibodies (h). The percentage of ciliated cells in GFP-control or GFP-Aurora A-positive group (i). DNA was stained by DAPI (blue). Scale bars, 10 μm. n, the number of total cells calculated. Data are shown as the means ± SD from at least three independent experiments. Student’s t-test; ns, not significant; *P < 0.05, **P < 0.01, ***P < 0.001.

Acknowledgments
This image is the copyrighted work of the attributed author or publisher, and ZFIN has permission only to display this image to its users. Additional permissions should be obtained from the applicable author or publisher of the image. Full text @ Cell Discov