
Image
|
Figure Caption
Figure 7
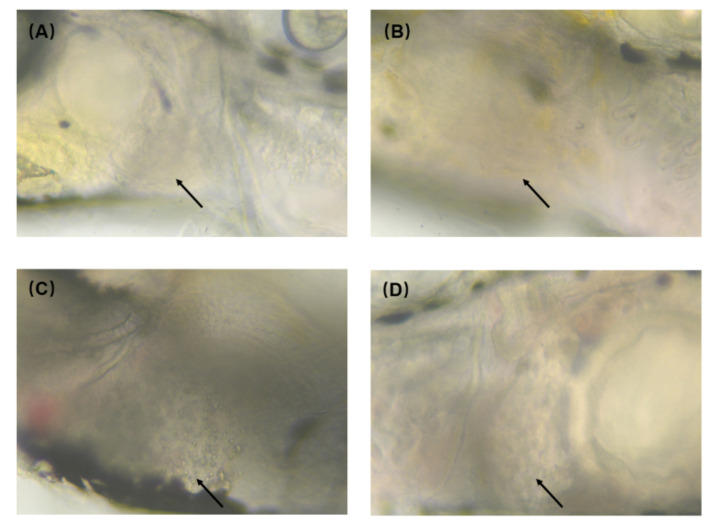
Figure 7. Alleviation of 125 nmol/mL Nano-ZnO toxicity by CDs: (A) control group, (B) CDs group, (C) Nano-ZnO group, (D) CDs + Nano-ZnO group. The arrow sites are zebrafish liver. (A,B,D) are normal zebrafish liver. (C) has obvious lipid droplets.
Acknowledgments
This image is the copyrighted work of the attributed author or publisher, and
ZFIN has permission only to display this image to its users.
Additional permissions should be obtained from the applicable author or publisher of the image.
Full text @ Toxics