
Image
|
Figure Caption
Figure 6
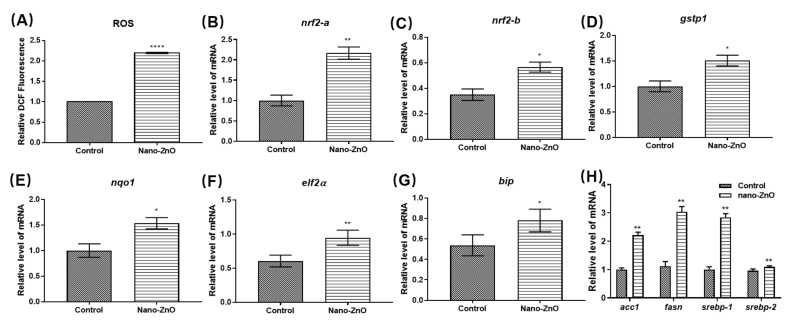
Figure 6. Mechanism of liver injury caused by 125 nmol/mL Nano-ZnO. (A) Relative levels of ROS; changes in mRNA levels of antioxidant signaling pathways (B) nrf2-a, (C) nrf2-b, (D) gstp1, and (E) nqo1; changes in mRNA levels of ER stress-related genes (F) elf2a and (G) bip. (H) Changes in mRNA levels of the lipid metabolism-related genes acc1, fasn, strebp-1 and strebp-2. (n = 30, * p < 0.05, ** p < 0.01, **** p < 0.0001).
Acknowledgments
This image is the copyrighted work of the attributed author or publisher, and
ZFIN has permission only to display this image to its users.
Additional permissions should be obtained from the applicable author or publisher of the image.
Full text @ Toxics